
Executive summary
October CPI rose 0.4% on the month with core at 0.3% for a third month; the 2-year Treasury par yield jumped 17 basis points to 4.73%. SPY slipped 0.37% to $749.92 and QQQ 0.68% to $674.76, yet the median S&P 500 stock was unchanged, 49.1% of members rose and dispersion collapsed to the 17th percentile of the past year. The damage sat in NVIDIA, down 5.47% to $168.89 amid investigation headlines, and the AI 30 count above the 50-day slipped to 4 of 30. Our view: Monday's opening prices held and the broad market still reads as a pullback inside an uptrend, so we lean modestly bullish on the broad market into Friday's PPI, with the bull and base scenarios carrying 70% of our weight and the bear trigger named: a close below $741.95 in SPY or $662.64 in QQQ. The warning sign we named on Monday, "core CPI at 0.3% or higher with the 2-year yield rising from 4.56%", is now live, which keeps the lean modest, and concentrated AI remains the laggard until its repair count turns.
Section by section
Pulse: why was the market down? Mostly, it was not
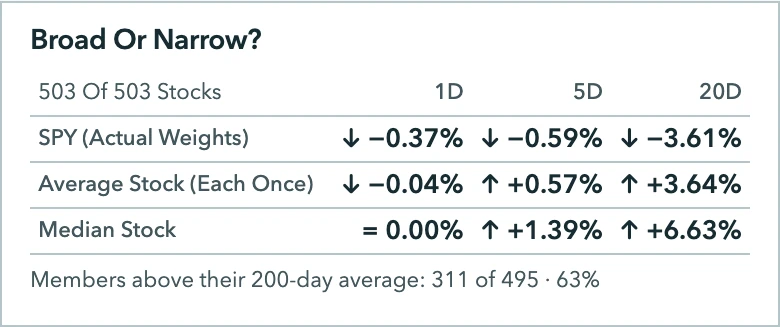
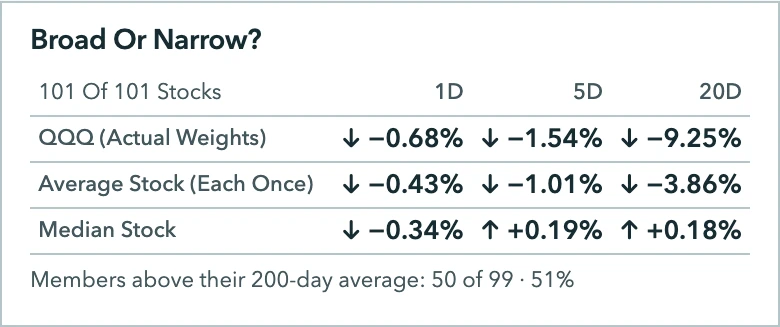
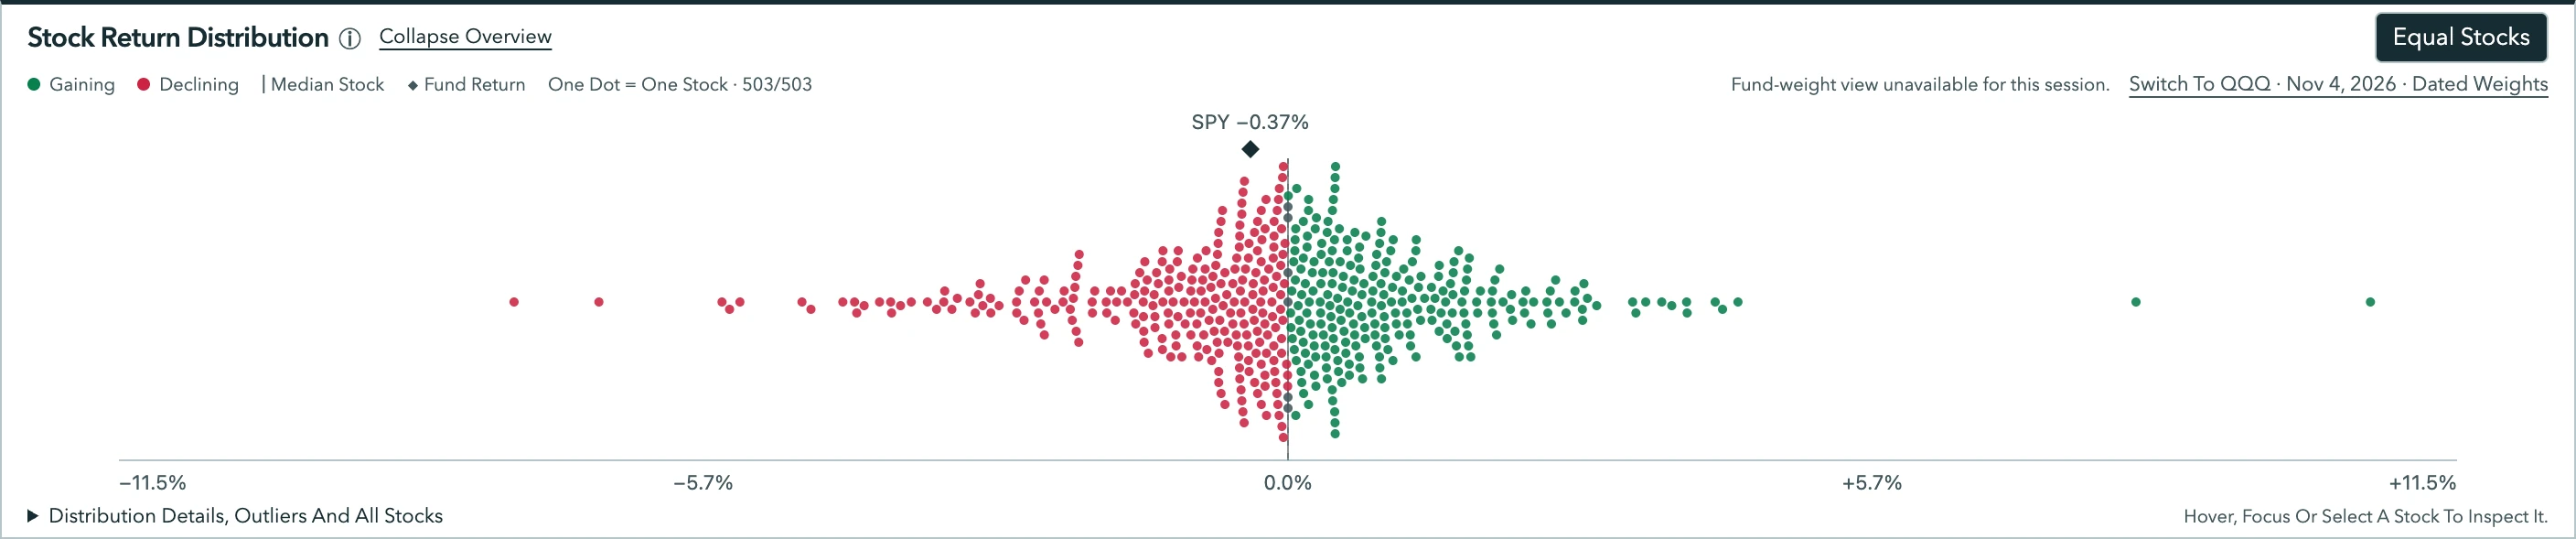
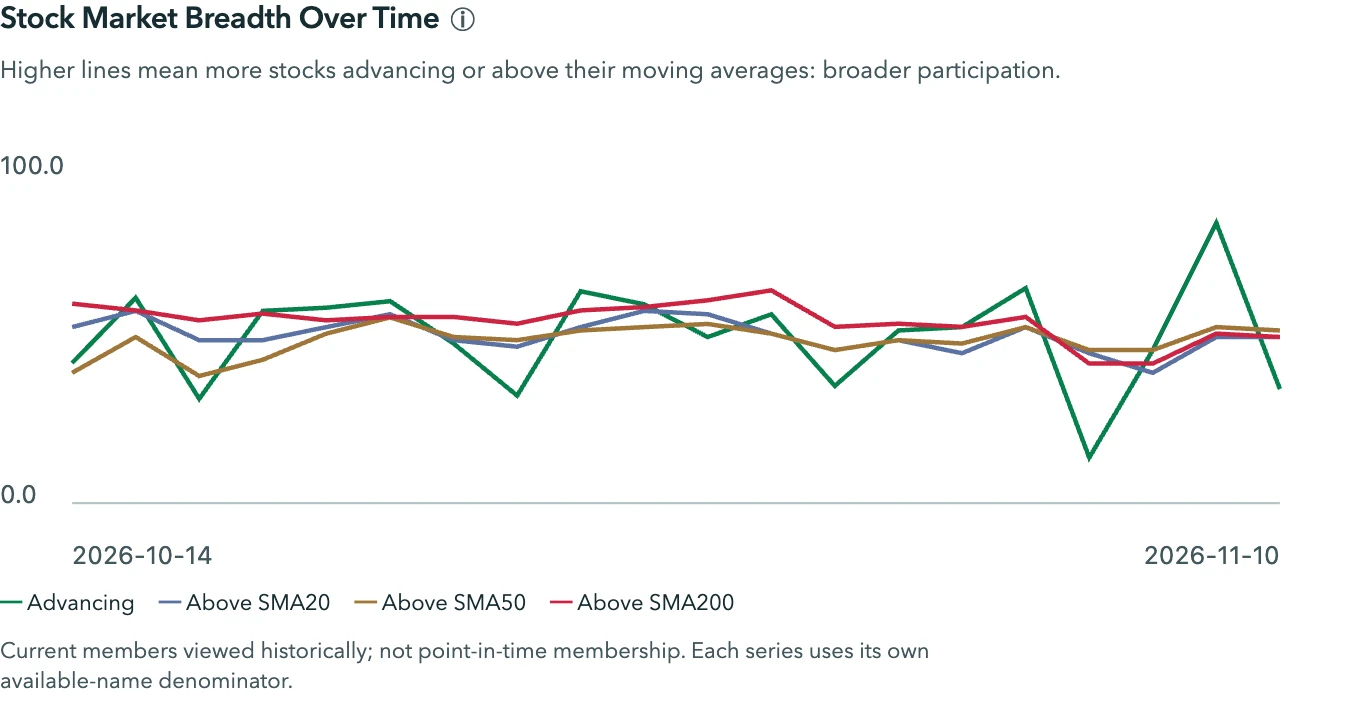
SPY: −0.37%, 49.1% of 503 members advancing, 71% / 69% / 63% above the 20-, 50- and 200-day averages. QQQ: −0.68%, 34.7% advancing, 50% / 52% / 51%. AI 30: 7 of 30 up, 23% / 13% / 37%. A fund down with a flat median stock is a cap-weight decline; the weakness sits, as all month, in the AI names.



The session: a lower open, a steady climb, an inside day
SPY opened at $747.94, ranged $744.86 to $752.14 and closed at $749.92; QQQ opened at $672.54, ranged $667.05 to $680.95 and closed at $674.76, both inside Monday's ranges. On Monday we named that session's opening prices, $741.95 and $662.64, as the lines; both held, the closes 7.97 and 12.12 points above them. QQQ's other line, its 200-day at $681.17, was not reclaimed: the high was $680.95 and the average is now $681.42. Reuters attributed the declines to the CPI print and Fed remarks that raised December hike pricing.
How deep is the correction?
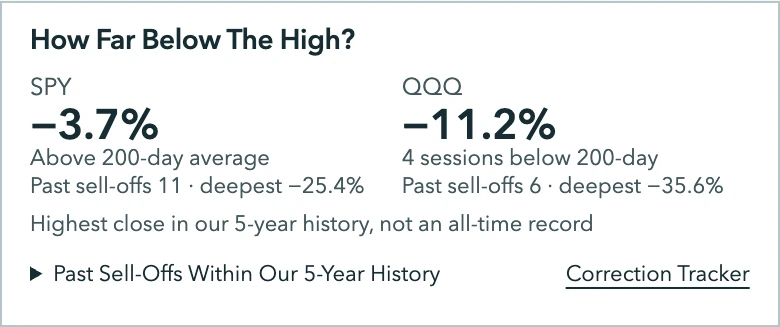
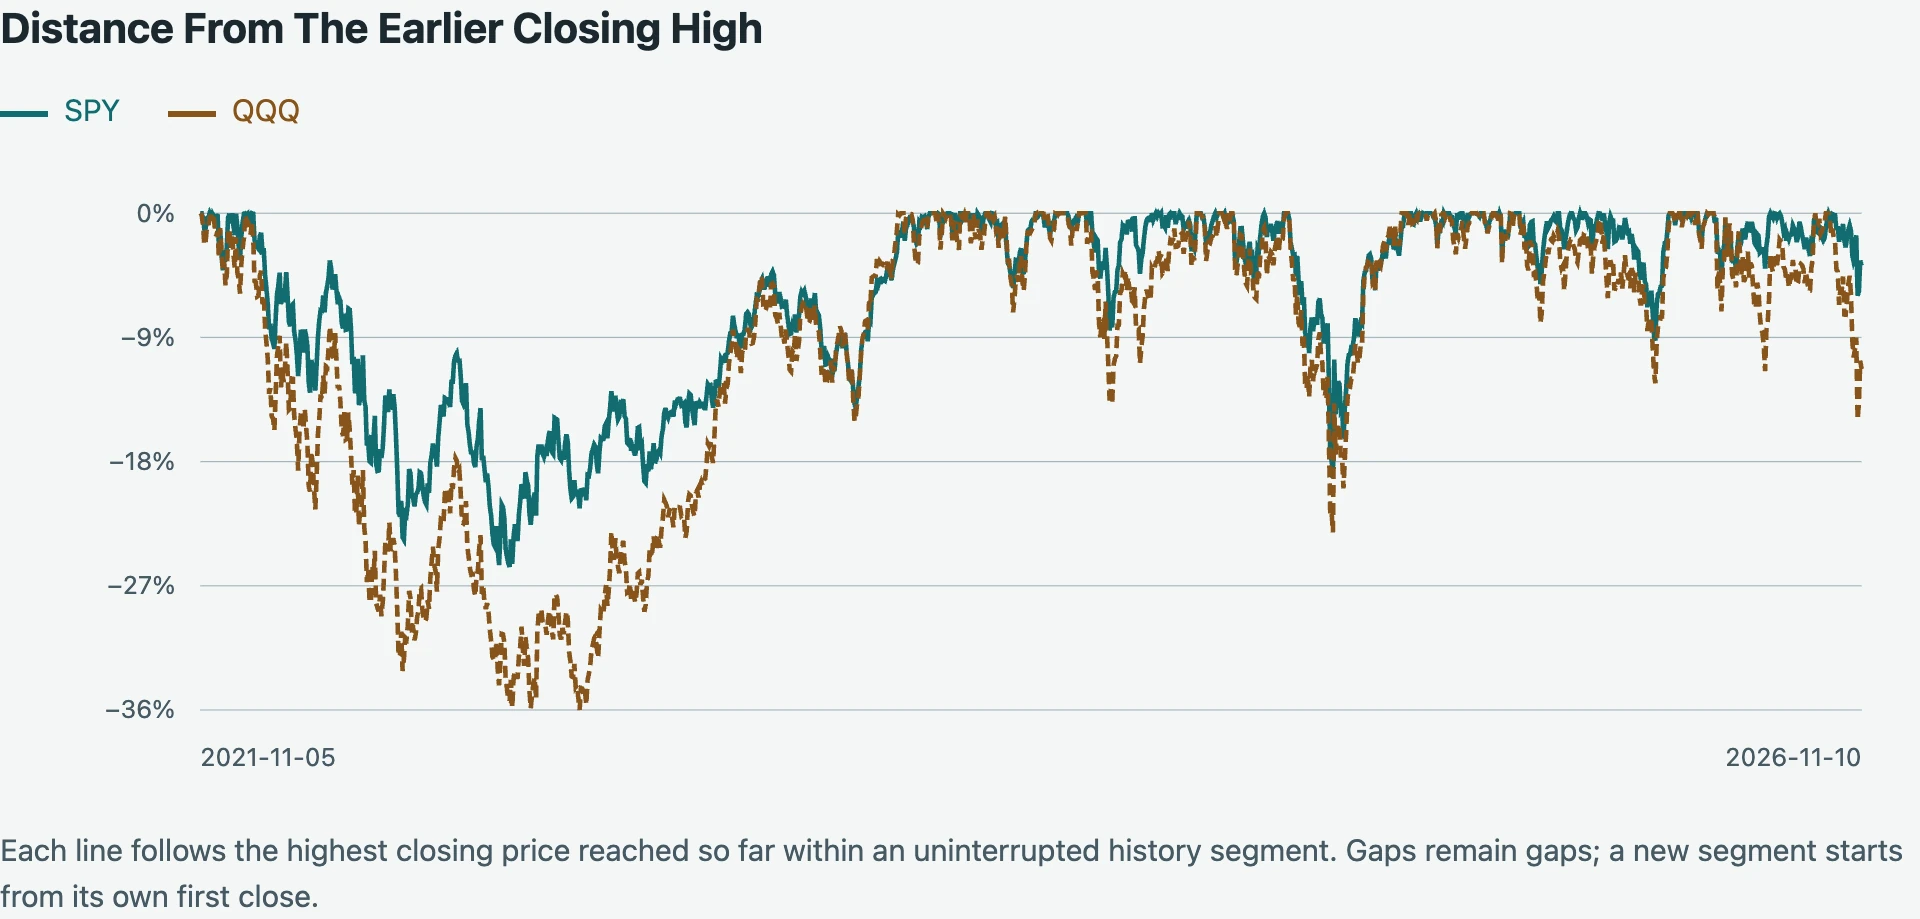
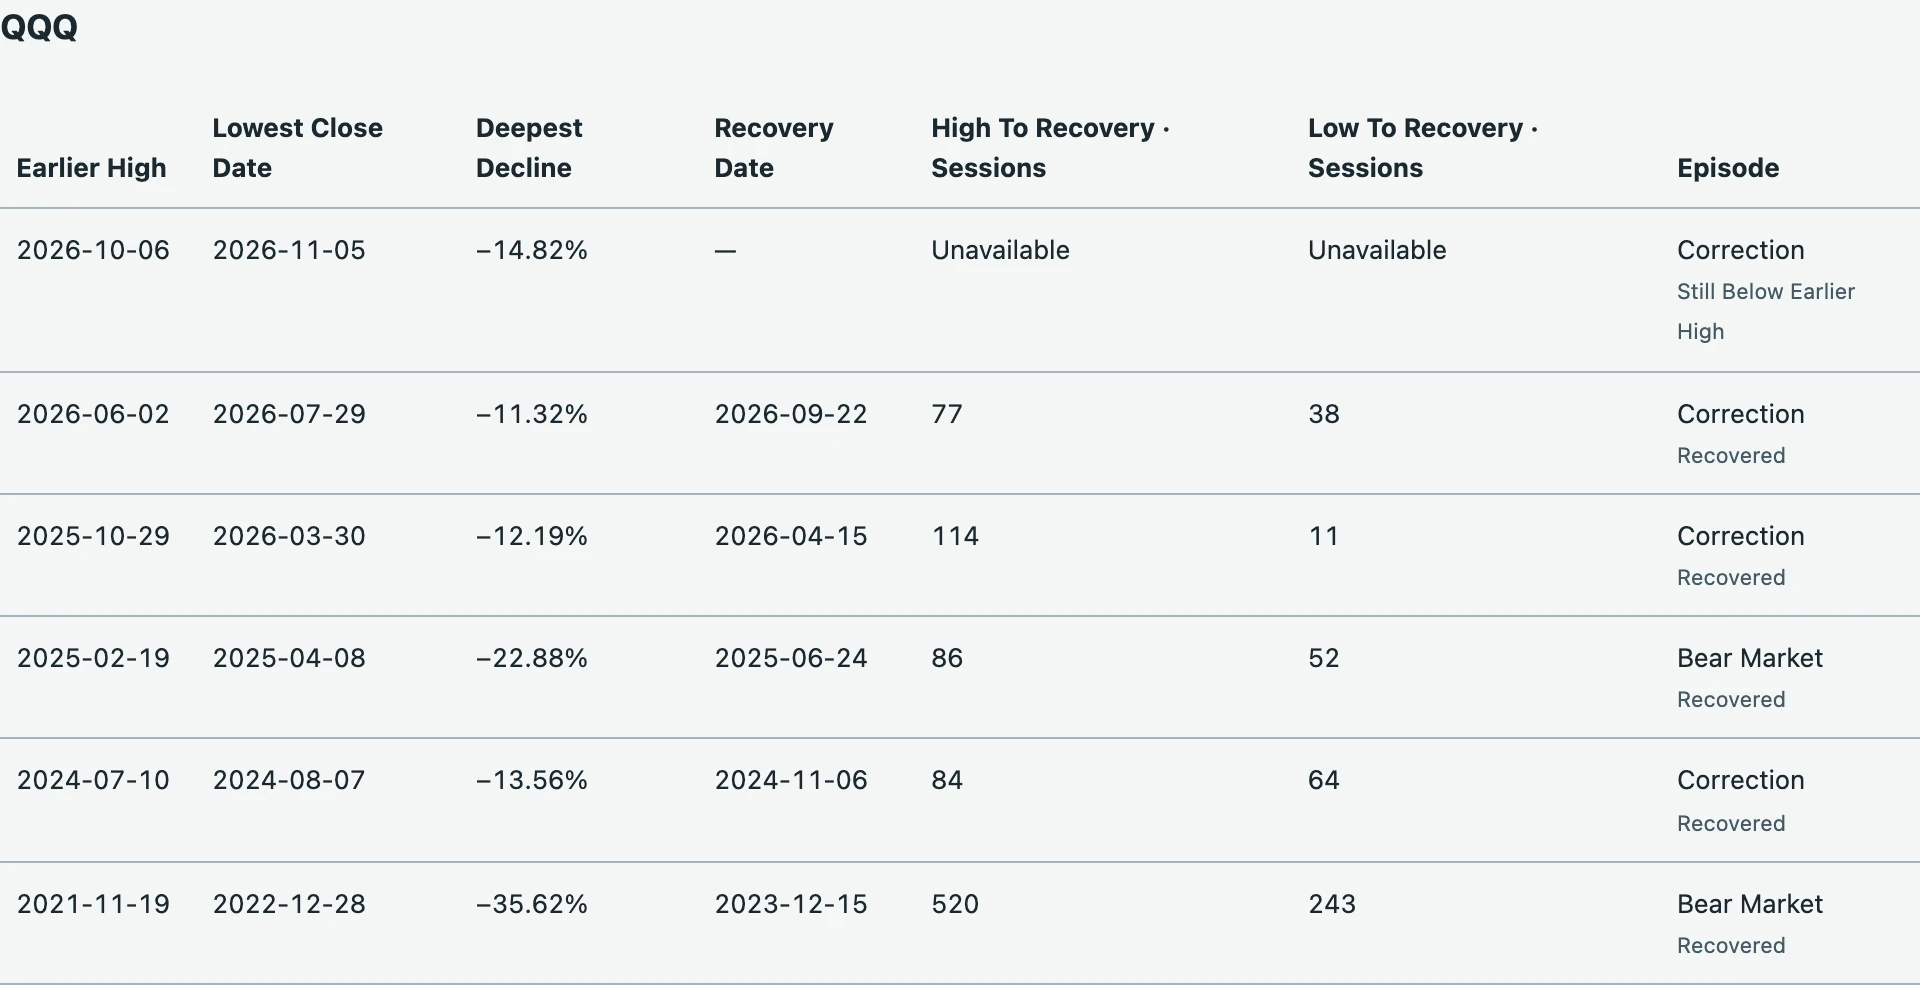
SPY closed 3.74% below its October 6 closing high and QQQ 11.18% below. The Correction Tracker keeps QQQ's episode open at a deepest decline of 14.82% on November 5; SPY has no open decline of 10% or more. History, not a forecast: this episode is already deeper than every completed QQQ correction in our five-year history; only the 2022 and 2025 bear markets (35.62% and 22.88%) went further.
AI 30 Health: the repair count went the wrong way
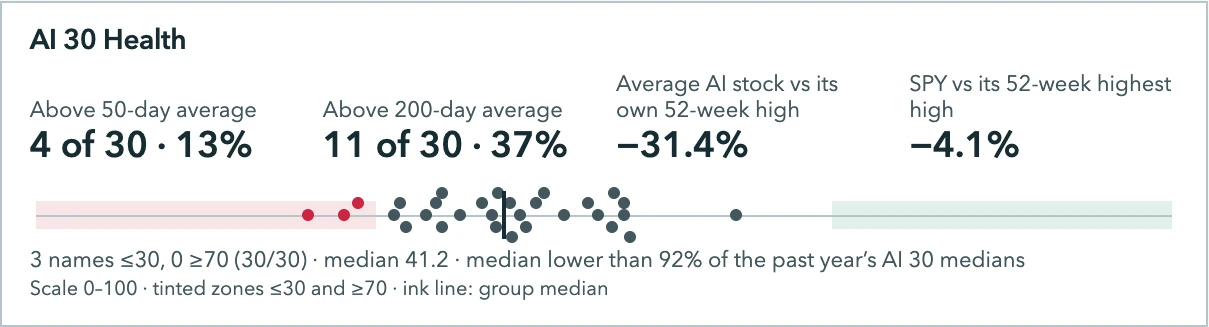
Four of 30 AI names are above their 50-day average (13.33%, from 5), 11 above their 200-day (36.67%, from 12), and the average AI stock is 31.40% below its 52-week high, from 30.80%, against 4.06% for SPY. On Monday we wanted this count rising from five toward a third; it fell to four, moving away from repair.
Broad or narrow? A weighted decline over a flat median
SPY's −0.37% compares with an average-stock return of −0.04% and a median of exactly 0.00%; over 20 sessions the fund is −3.61% while the average stock is +3.64%. QQQ: −0.68% against −0.43% and −0.34%. Contributions are unavailable, so we cannot measure NVIDIA's and Microsoft's share; in our view a flat median under a falling fund points there.
Distribution and breadth history: dispersion collapsed
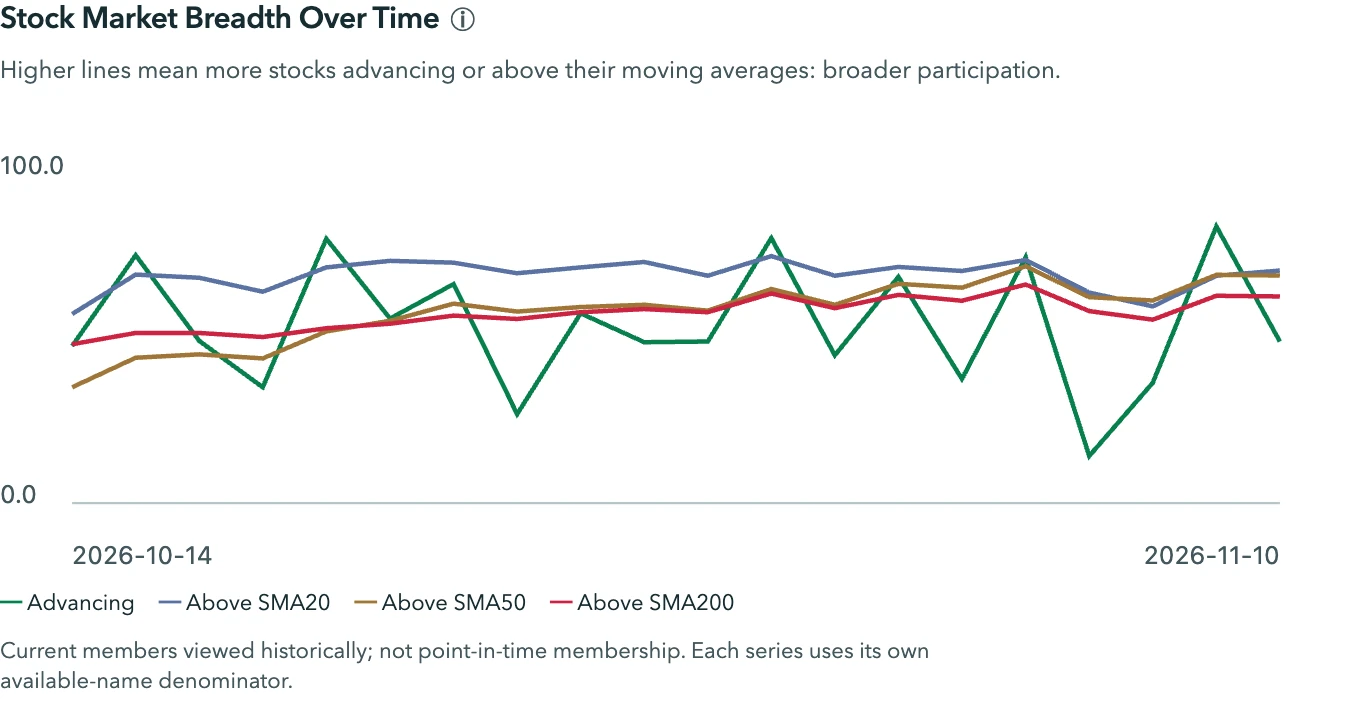
S&P member dispersion fell to 1.71 percentage points, the 17th percentile of the past year, from 2.89; the Nasdaq-100's to 2.00 from 4.19. On Monday we flagged 55% of S&P members above their 200-day and new lows exceeding new highs as warning lines; Tuesday read 62.8% (from 63.0% Monday and 55.8% Friday), with 7 new 52-week highs against 3 new lows (Aptiv, Axon, Coinbase). The highs-and-lows chart and dated readings table repeat these values.
Leaders and laggards: cable and games up; Nvidia, solar and homebuilders down
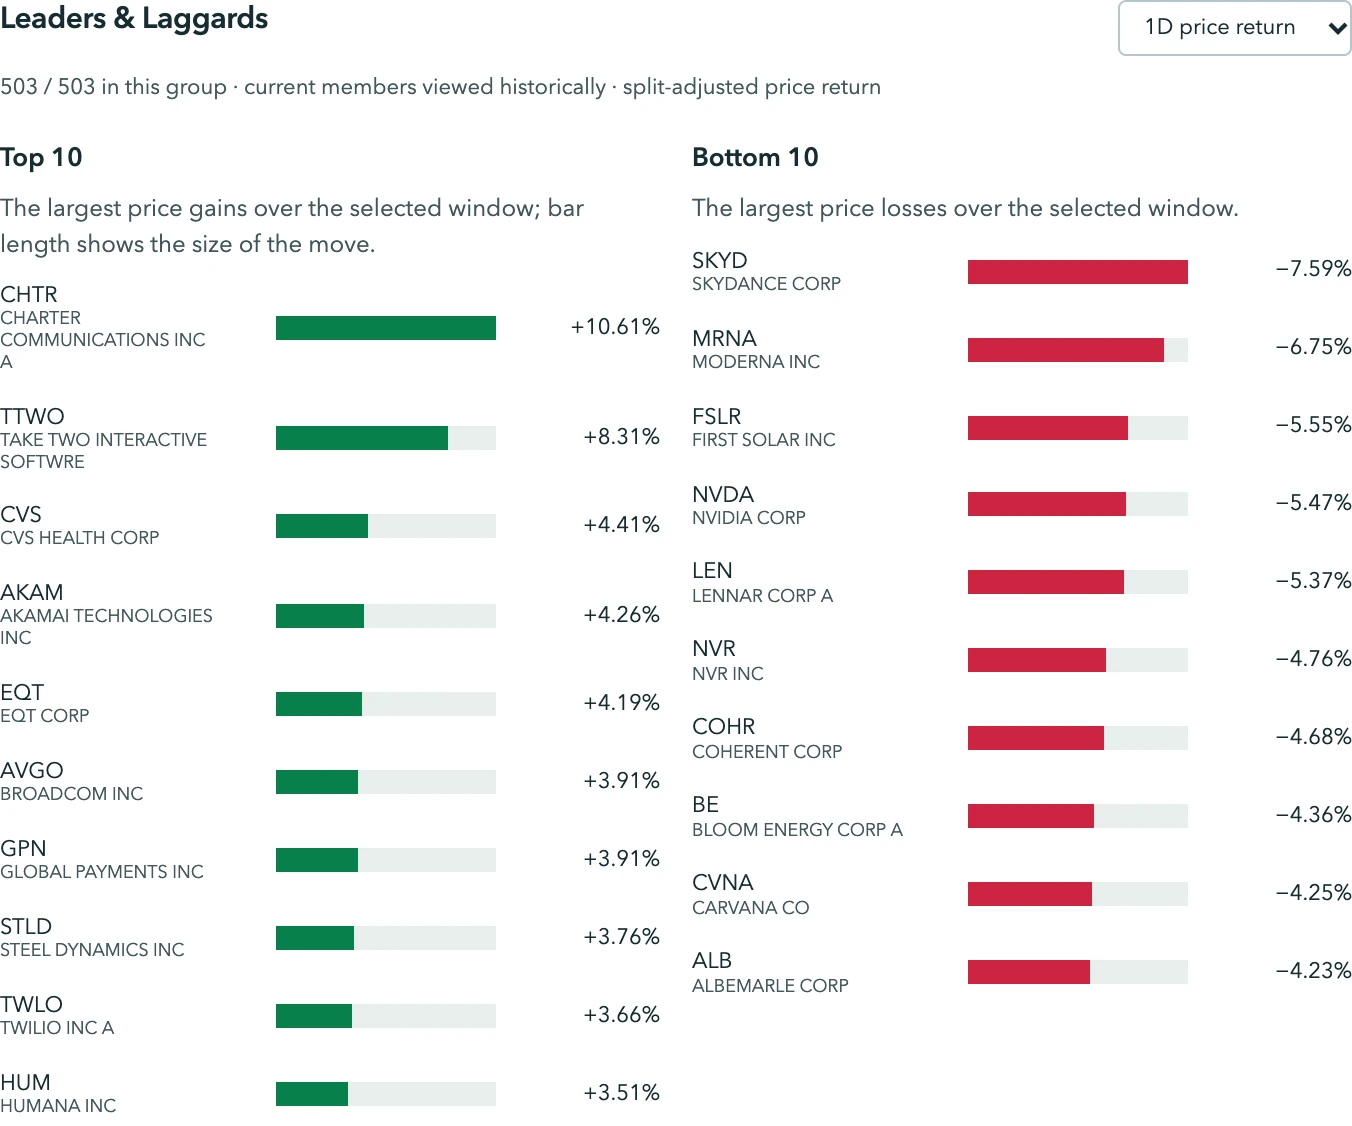
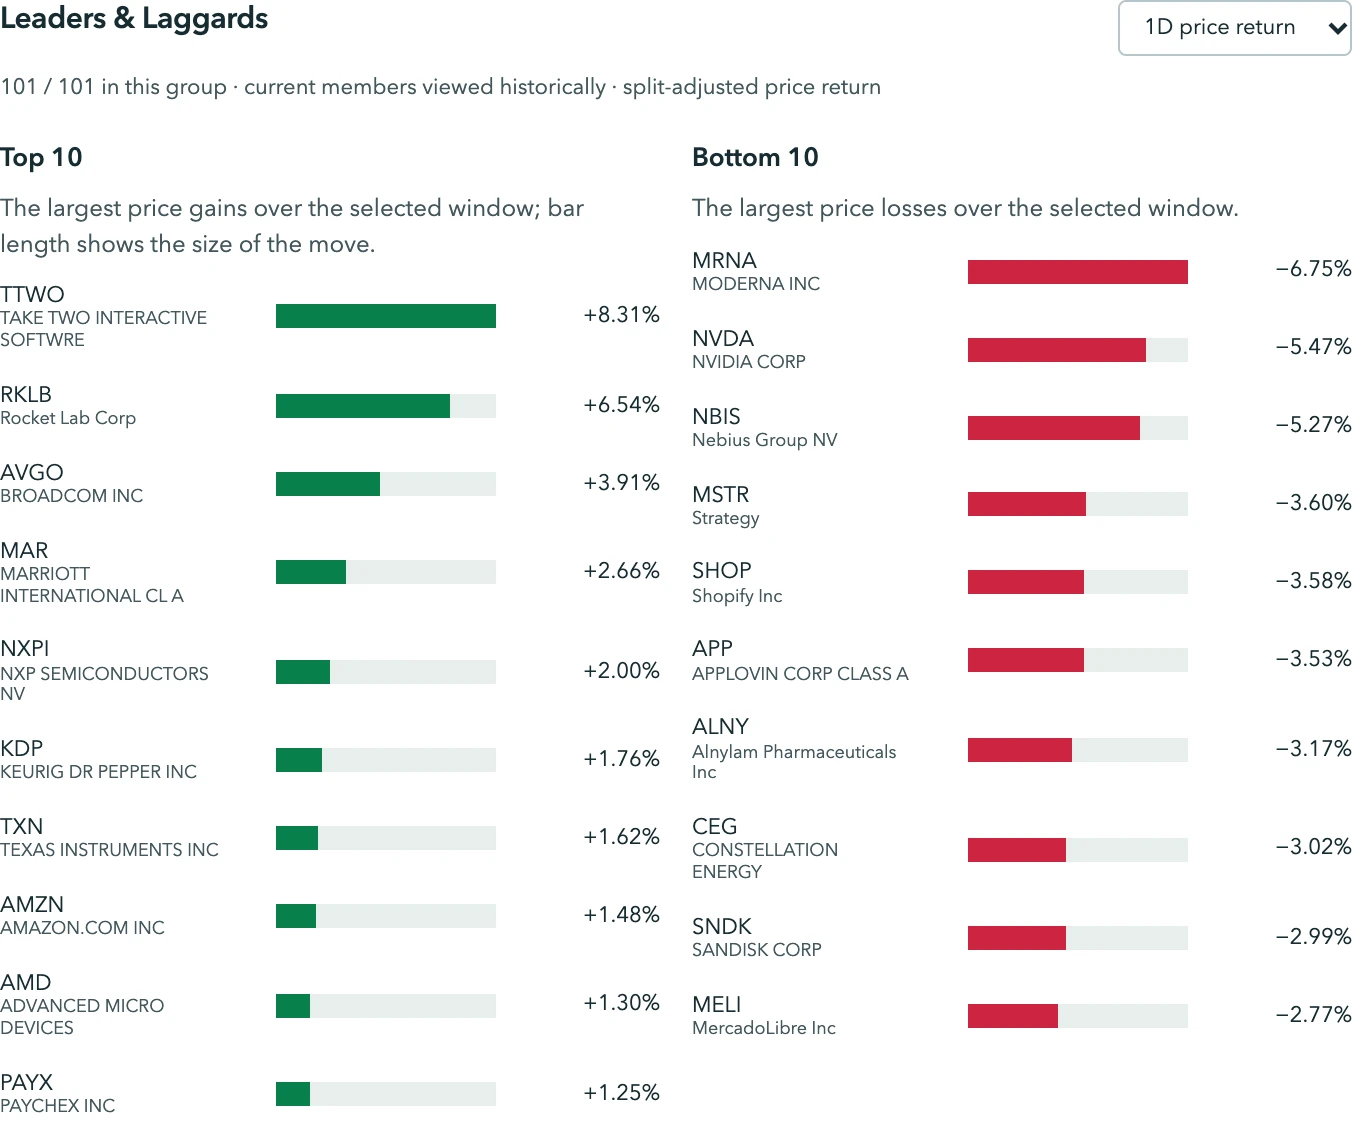
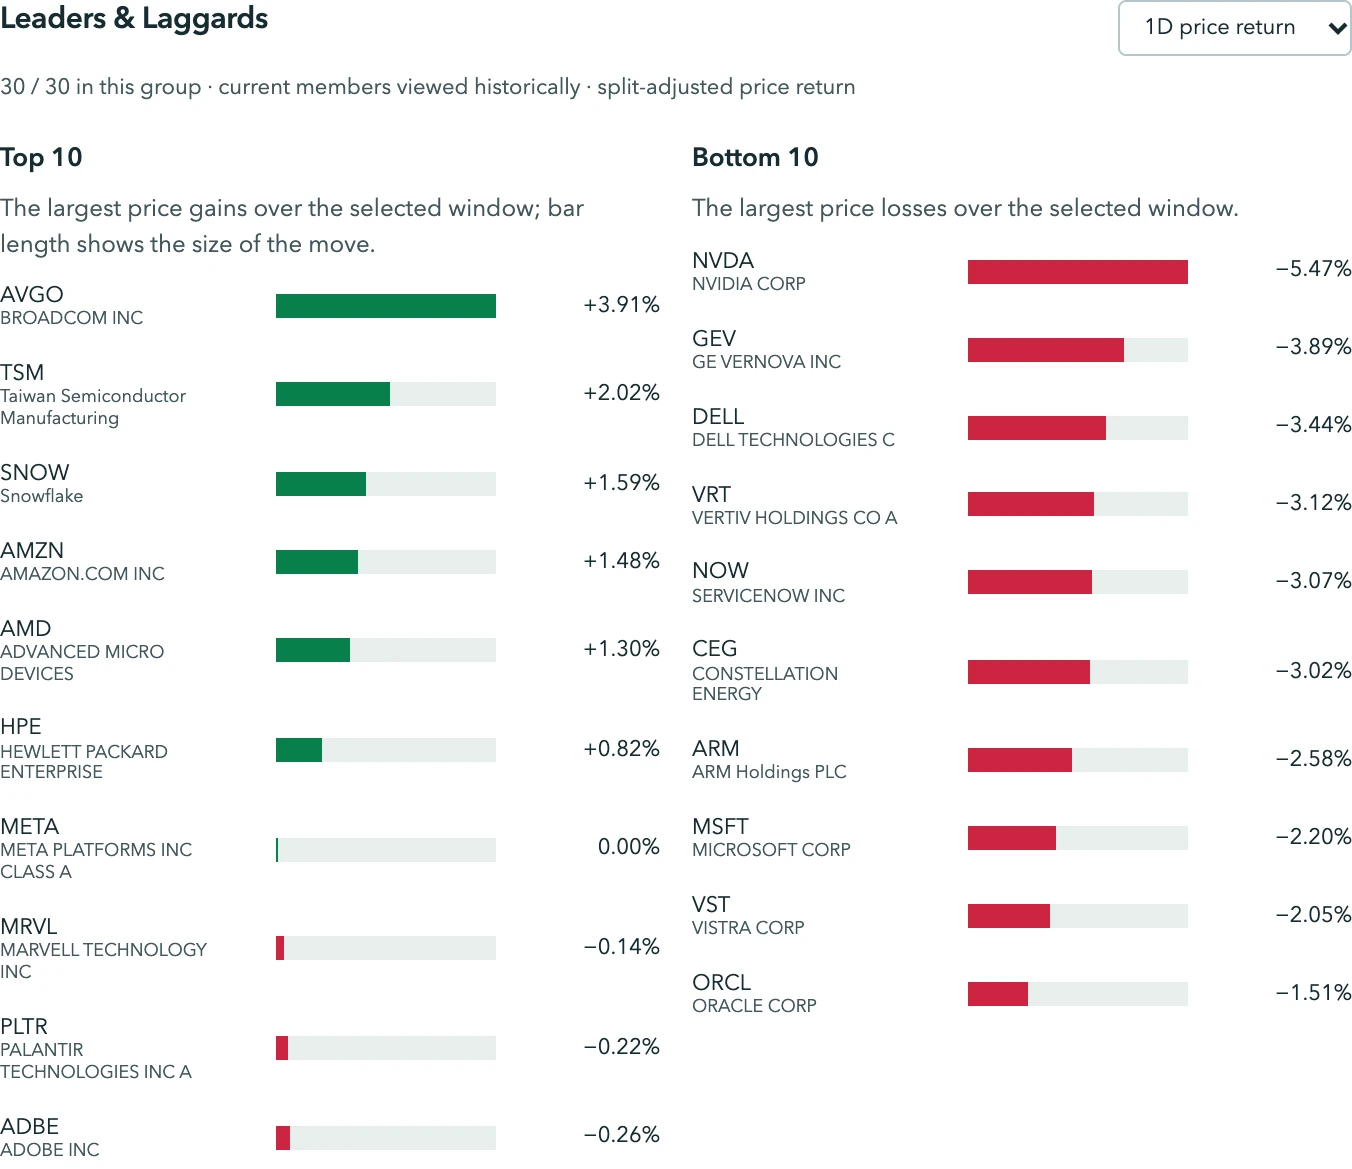
S&P leaders: Charter +10.61%, Take-Two +8.31%, CVS Health +4.41%, Akamai +4.26%, EQT +4.19%, with Broadcom +3.91% sixth. Laggards: Skydance −7.59%, Moderna −6.75%, First Solar −5.55%, NVIDIA −5.47%, Lennar −5.37%. In the AI 30, Broadcom and TSMC (+2.02%) led; NVIDIA −5.47%, GE Vernova −3.89% and Dell −3.44% trailed, and Microsoft, eighth-weakest, fell 2.20%. GE Vernova opened 8.90% lower and its low was 9.93% below Monday's close before it recovered.
What about Nvidia?
NVIDIA closed at $168.89, down 5.47% and 9.51% over two sessions by our arithmetic. On Monday we wanted it to hold $178.67 into its November 17 report; it has not so far ($168.89). Company facts: the independent directors retained Joon H. Kim, a former acting U.S. Attorney (SDNY), and Wachtell, Lipton, Rosen & Katz for the November 8 investigation into whether a foreign intelligence effort targeted Nvidia CEO Jensen Huang; no findings, timeline or leadership change were stated. A report by The Information (via Yahoo Finance) alleged the relationship with Alice Huang could have facilitated at least $7.5 billion of chip shipments through Chinese companies since 2023: unproven; Megaspeed denies wrongdoing and China calls the spy claim a smear. House China Committee chair John Moolenaar wants Congress to "get to the bottom" of it. There is no finding of misconduct; a stock trading on unverifiable headlines a week before results argues, in our view, for patience, not a directional call.
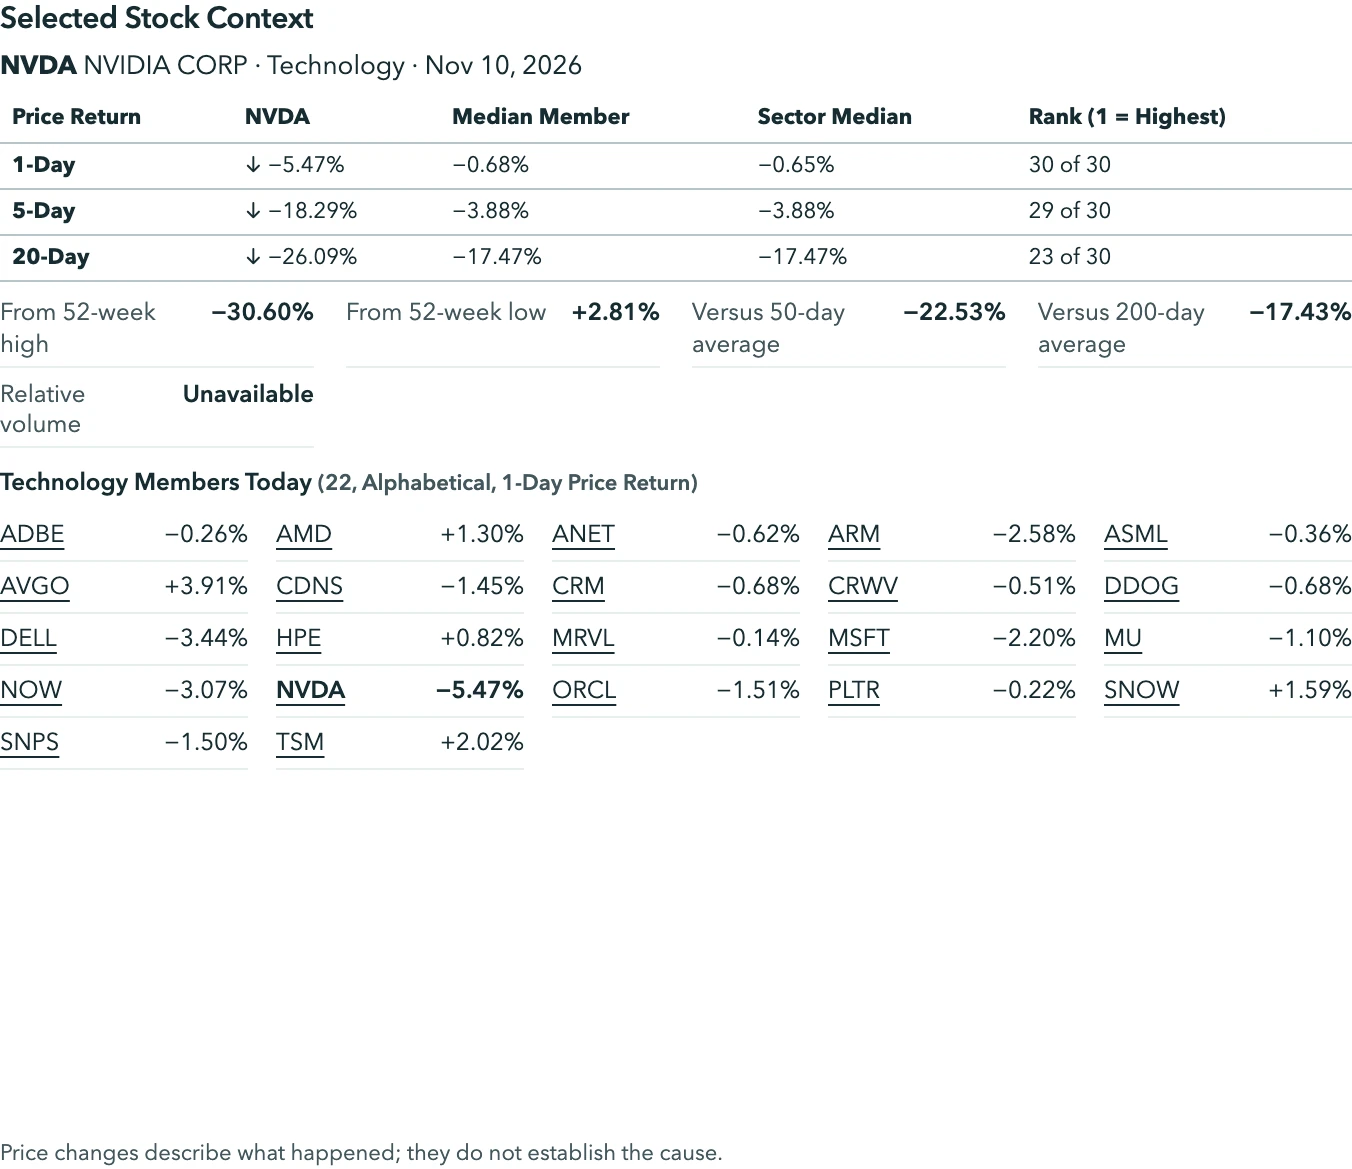
Held up in the sell-off: the new list
The new Held Up In The Sell-Off list: 388 of 502 S&P members with readings (77% by our arithmetic) and 59 of 101 Nasdaq-100 members (58%) did not close at a new 20-session low on November 5, the funds' worst day; on the AI 30 and crypto tabs this slot is a Selected Stock Context table.
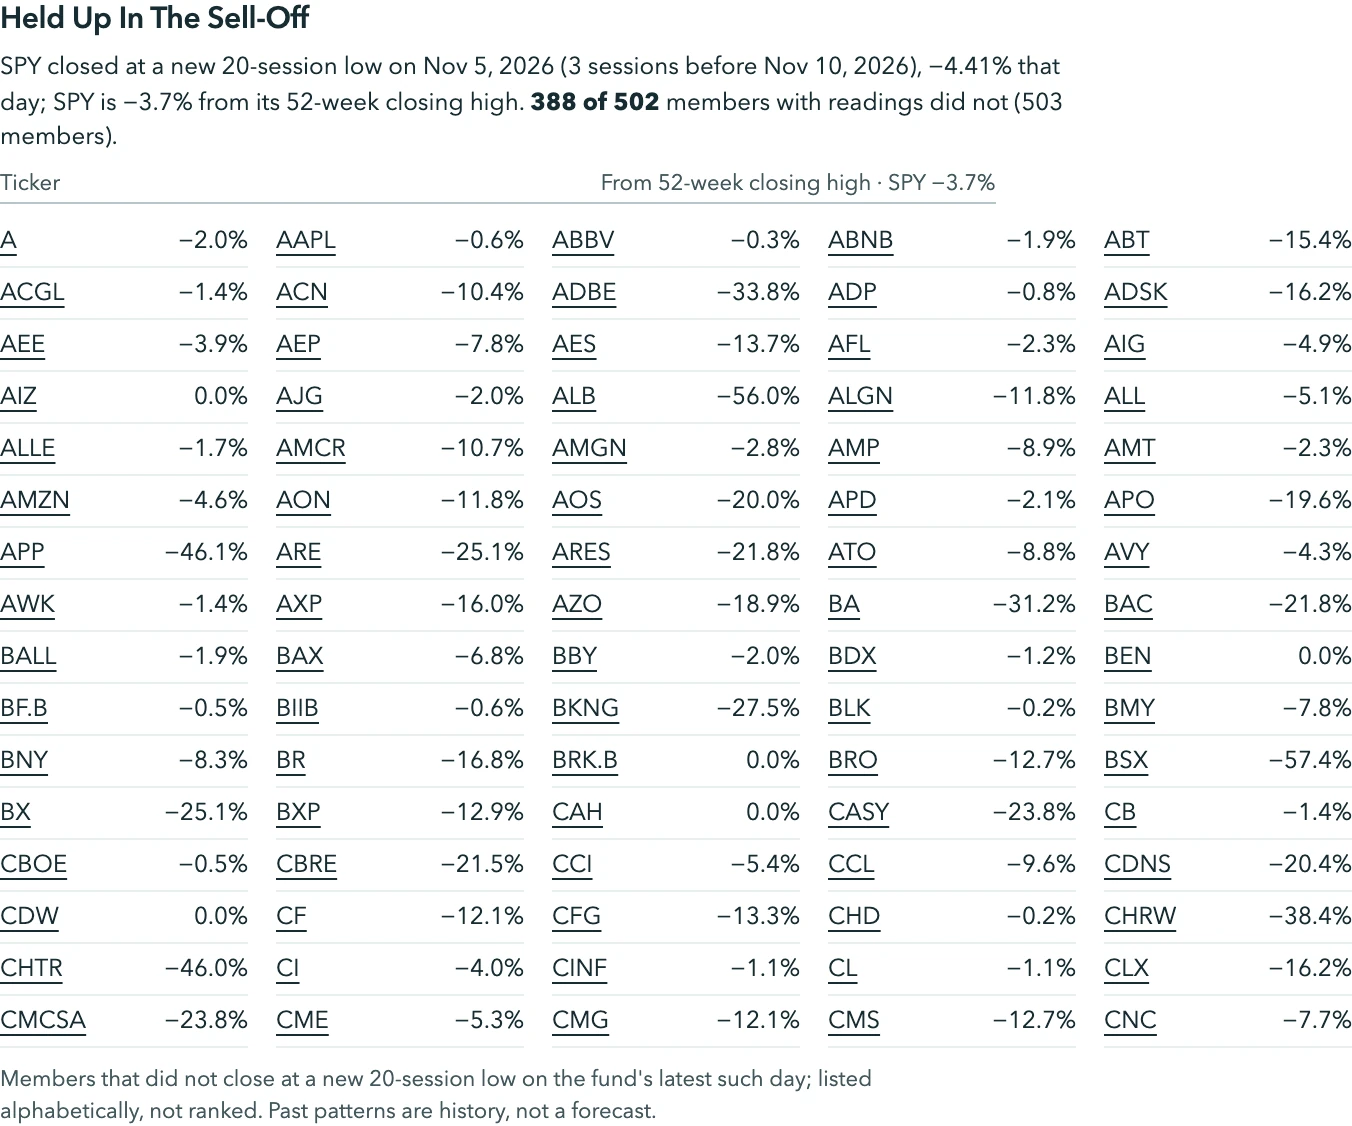
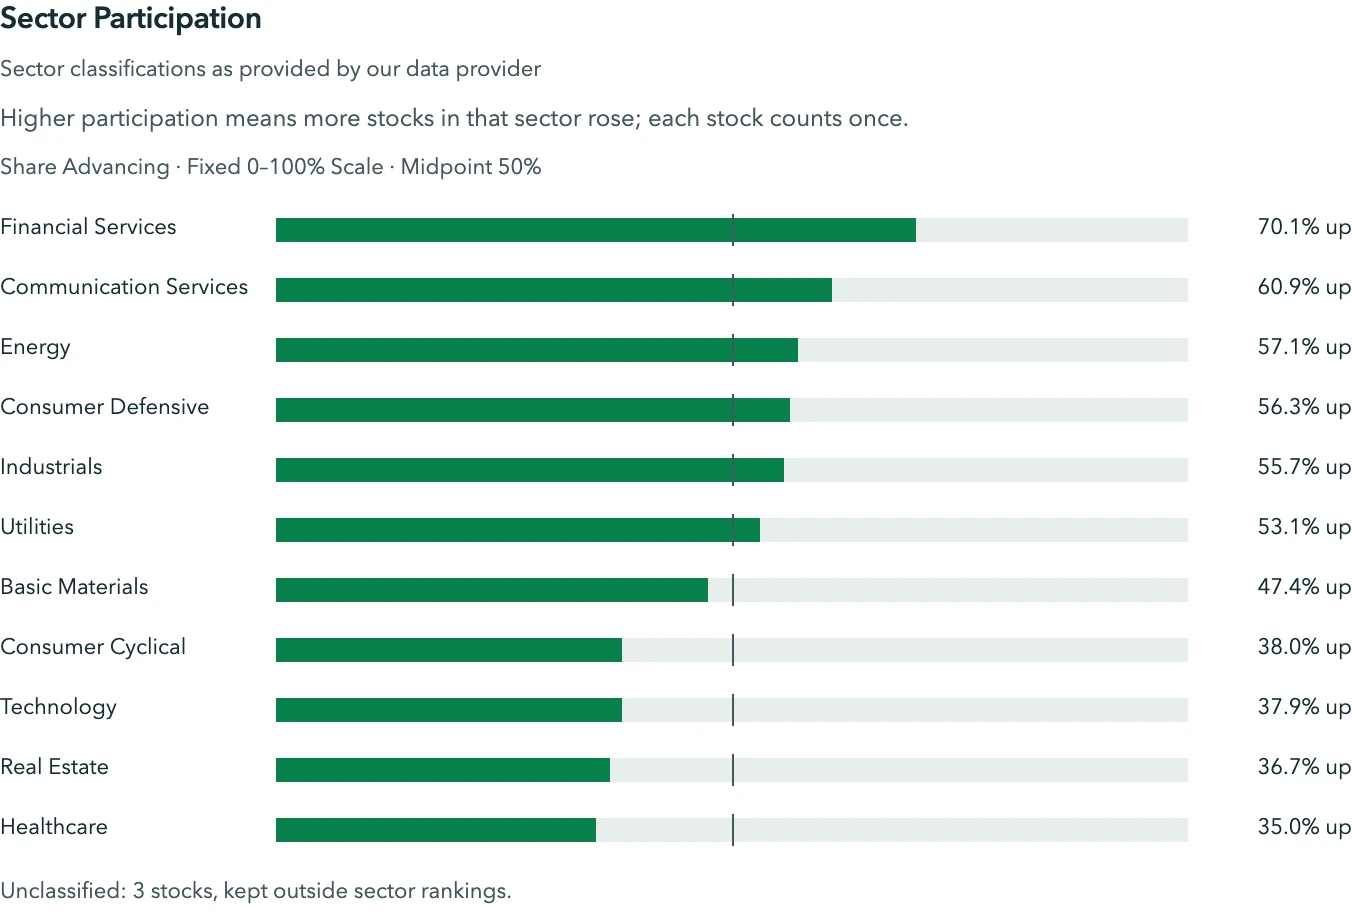
Sectors: Energy and Financials led, Healthcare and Real Estate trailed
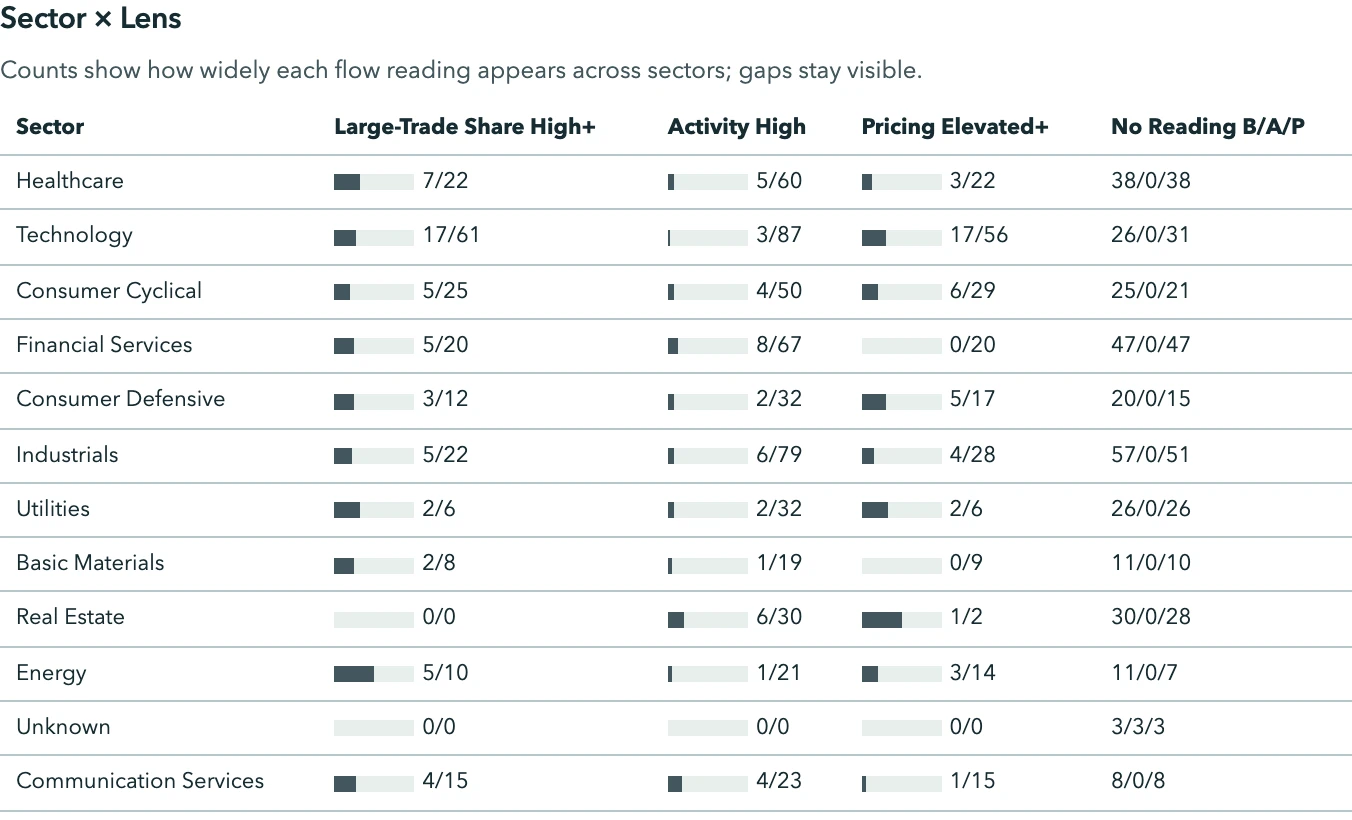
Six of eleven S&P sectors had a majority advancing, led by Financial Services (70.1%), Communication Services (60.9%) and Energy (57.1%); Healthcare (35.0%), Real Estate (36.7%) and Technology (37.9%) were narrowest. Energy led by median at +0.83%; Real Estate (−0.37%) and Healthcare (−0.33%) trailed. In the Nasdaq-100, 62.5% of Industrials rose against 24.4% of Technology. The Sector Participation Strip (20 sessions) shows alternating majorities, and the Sector × Lens table counts 55 high-or-above large-trade-share readings among 201 S&P members with readings, 17 of them in Technology; Rotation remains hidden.
Volume: a quiet tape
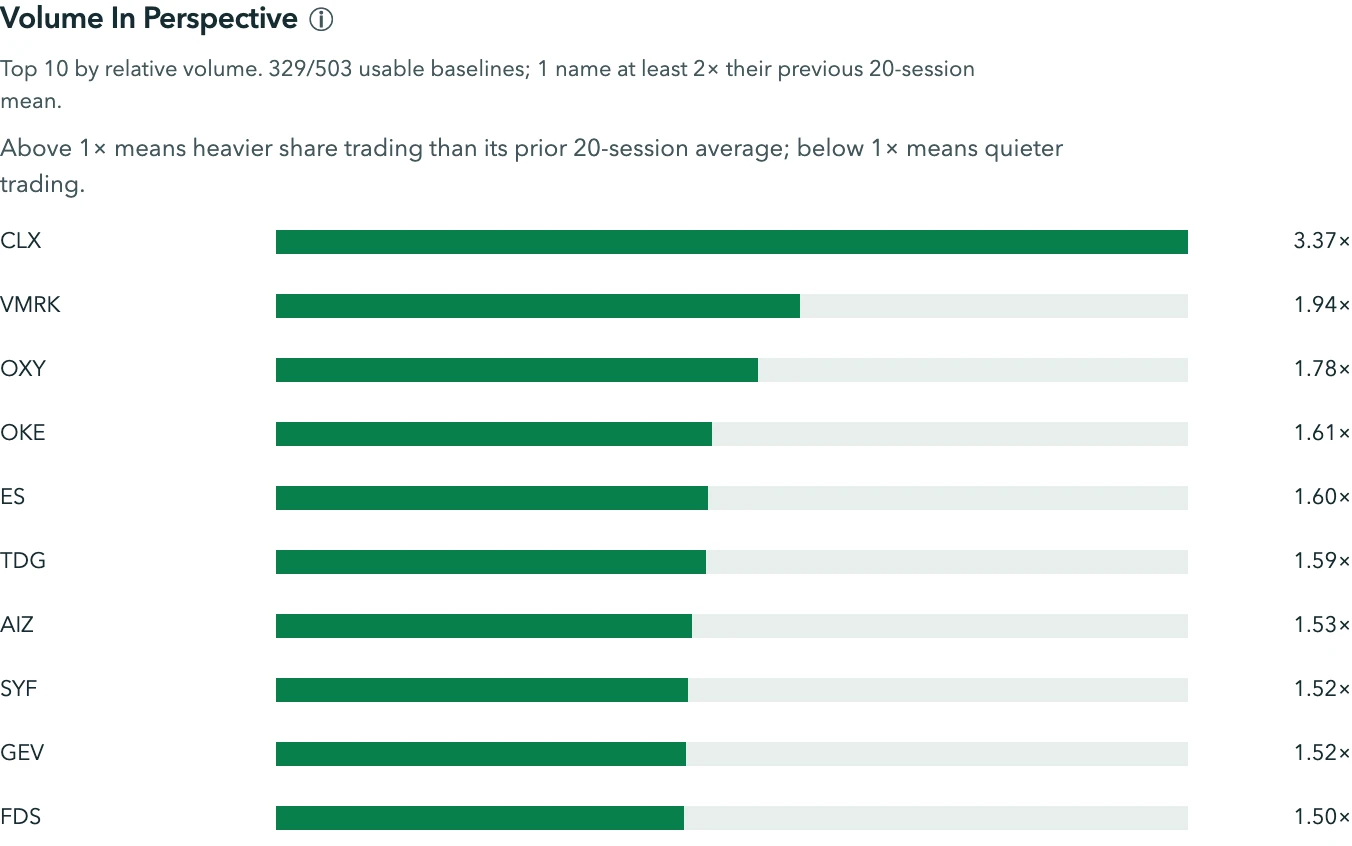
SPY's own relative volume was 0.82x and the median member's 0.78x (329 of 503 with baselines); the relative-volume histogram has one name, Clorox at 3.37x, at twice its 20-session mean. Volume is now available for the AI 30 (0.87x on 9 of 30) and the crypto list (1.03x on 3 of 7), still unavailable for QQQ; recent volumes remain provisional. In our view a 0.4% decline on four-fifths of normal volume is a market waiting, not obviously distribution.
Momentum: the oversold list is the correction's casualty list
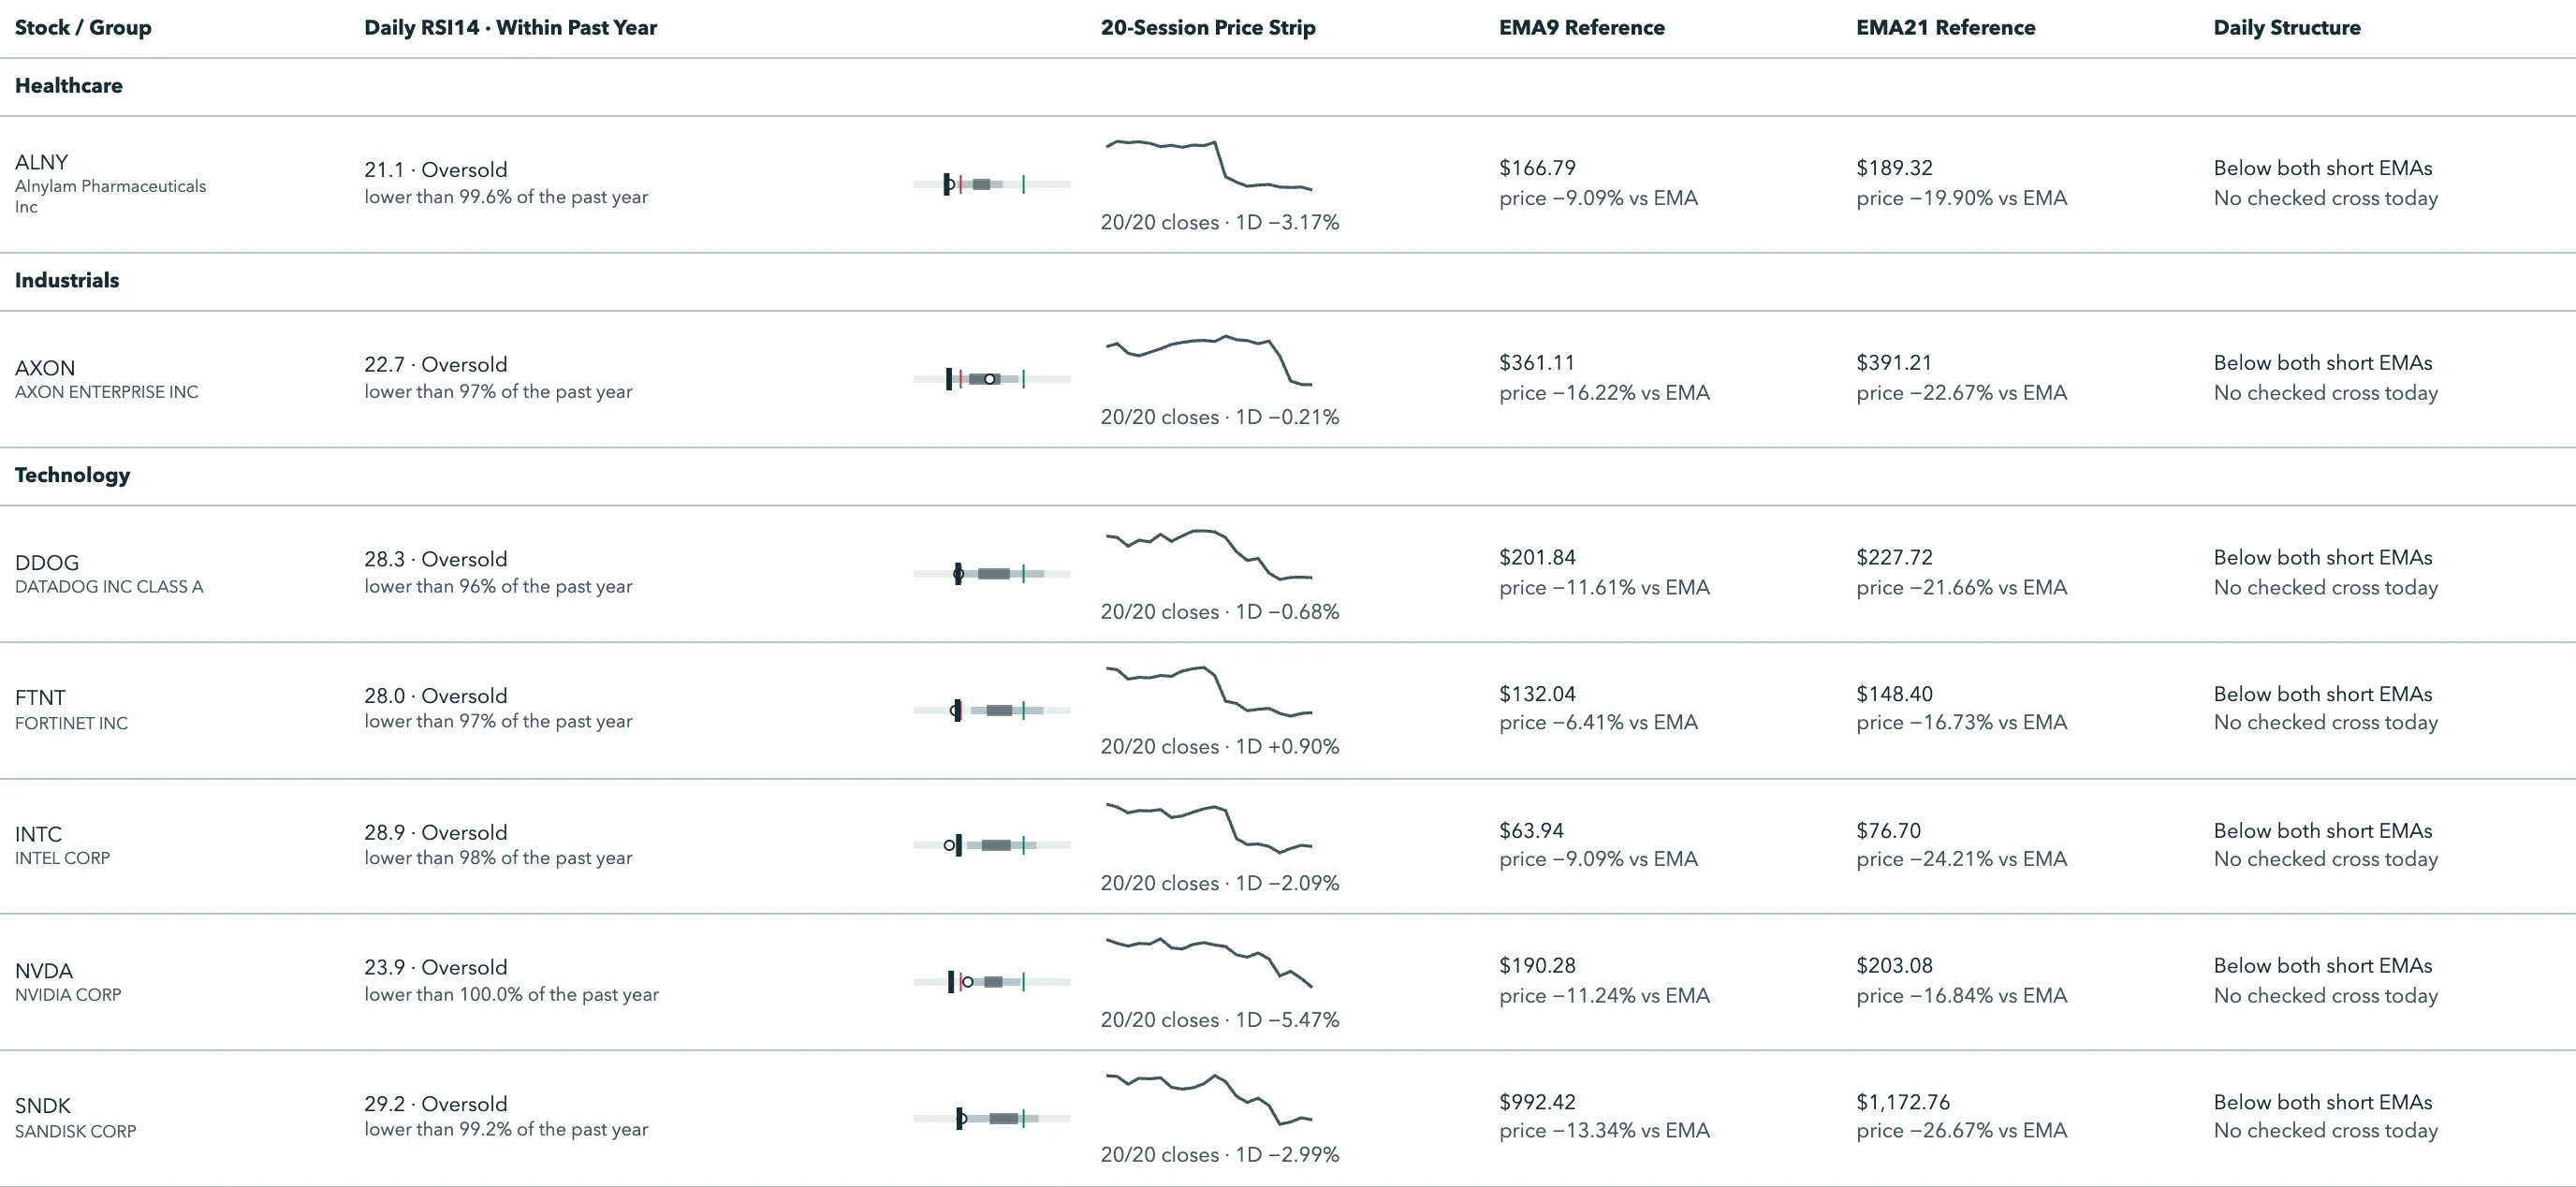
SPY's 14-day RSI eased to 44.6 from 45.8 and QQQ's to 40.1 from 41.4. The Nasdaq-100's seven oversold names include Alnylam, NVIDIA, Datadog and Axon; S&P oversold rose to 12 from 11, overbought to 42 from 37; the AI 30 and crypto tabs have no overbought names.
The AI Ecosystem tab, and CoreWeave after the close
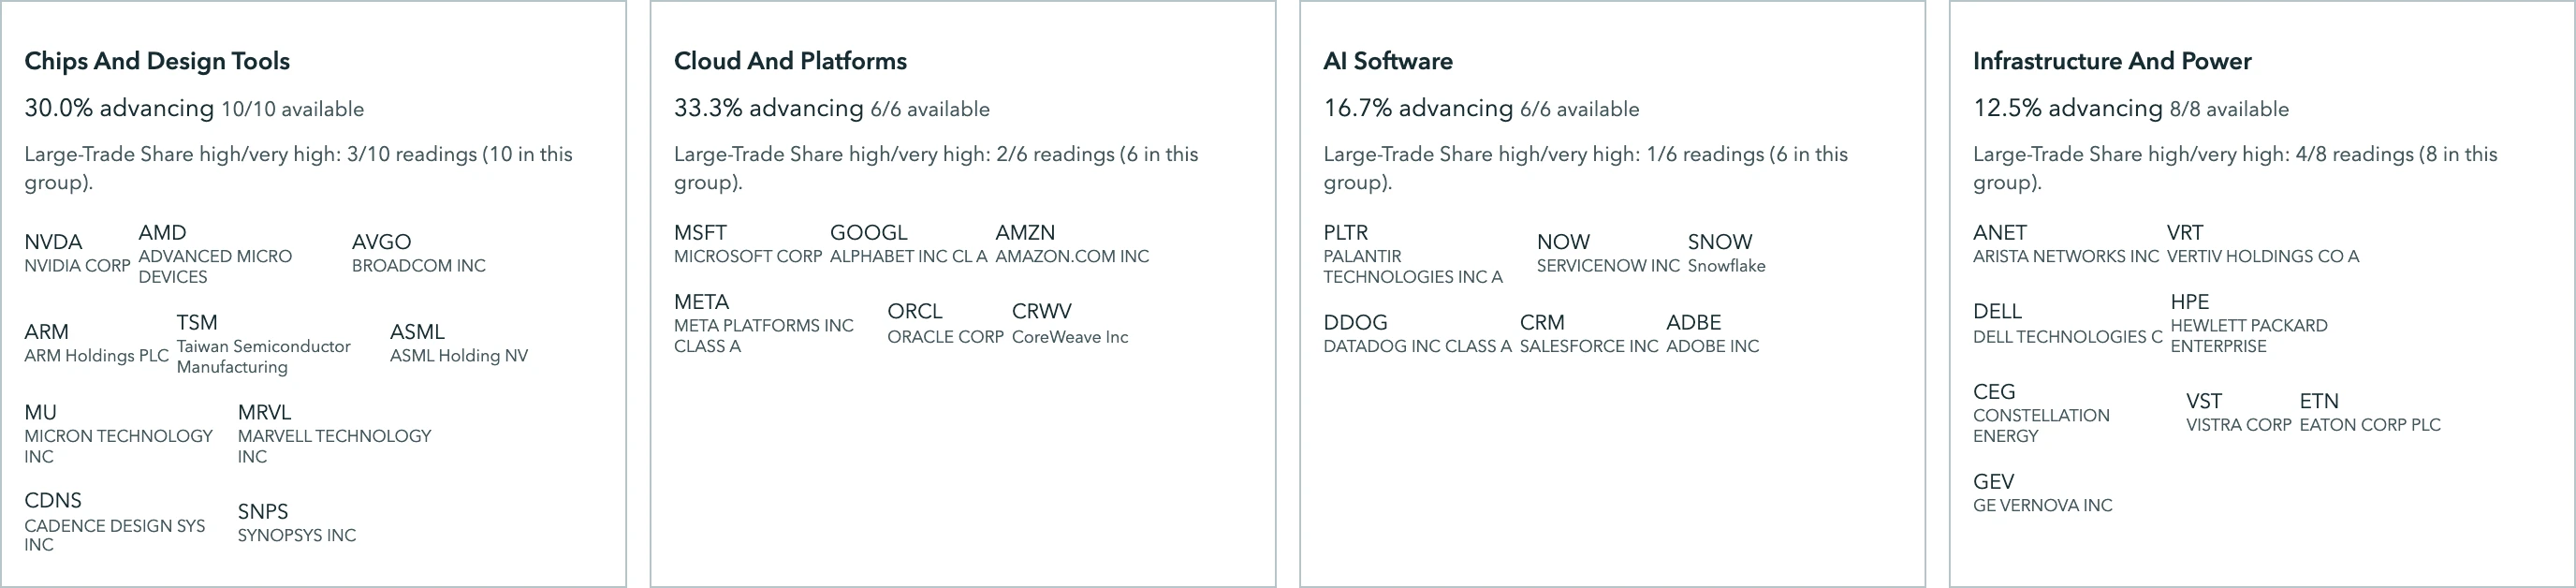
Chips And Design Tools: 30.0% advancing (3 of 10), from 90.0% on Monday. On the AI 30 tab, Consumer Cyclical (Amazon) was the only sector with a majority up (Technology 22.7%), the return distribution ran 7 up and 23 down around a −0.68% median, 7 of 30 names were above their 20-day (from 6), and there were no new 52-week highs or lows. After the close CoreWeave reported third-quarter revenue of $3,661 million and a 2026 revenue guide of $13.0–13.3 billion; CEO Michael Intrator called it a "breakout quarter" (company claims). The stock closed down 0.51%.
Crypto-related equities: no bid
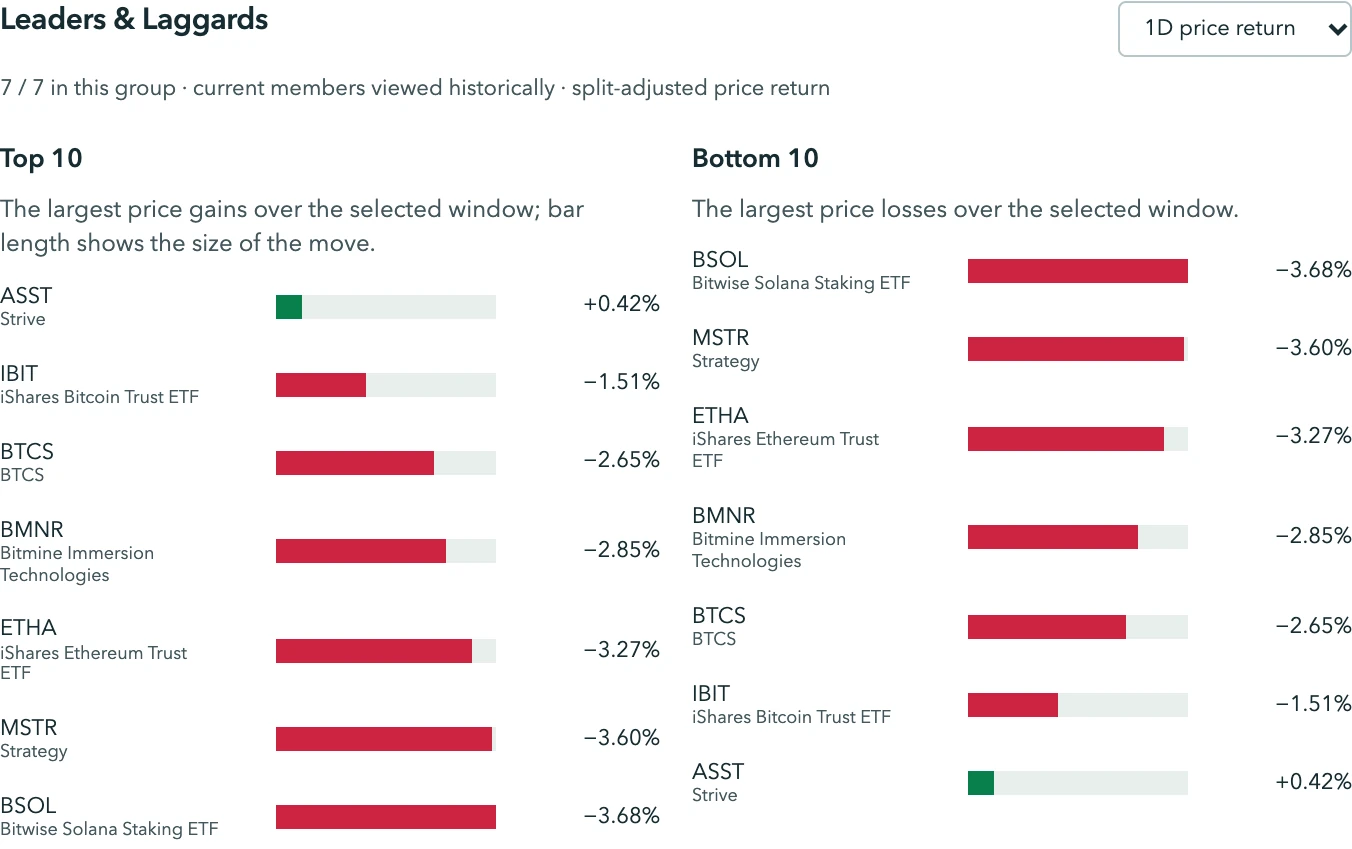
One of seven rose (Strive +0.42%); the Solana trust fell 3.68%, Strategy 3.60%, the Ethereum trust 3.27%, for a −2.85% median and −2.45% average. None is above its 20- or 50-day average, two are above the 200-day, there were no new 52-week highs or lows, the median 20-session return is −21.89%, and by sector only Financial Services had a name up (1 of 3). Yahoo Finance reported bitcoin briefly below $73,000.
Quiet and unavailable panels, in one line
The Metric Guide, Session In One Paragraph, Today's News (we cite its sources, not the panel), What Moved The Market Today (contributions unavailable), the stock chart, Lenses rail, Find A Stock and Share Previews are populated; Fund Bridge, Rotation, Big Moves, Flow Grid, Dividends and the Macro six views are unavailable; the sentiment and position lenses carry no labels.
Macro panel: carried yields, a CPI row that says "Not captured"
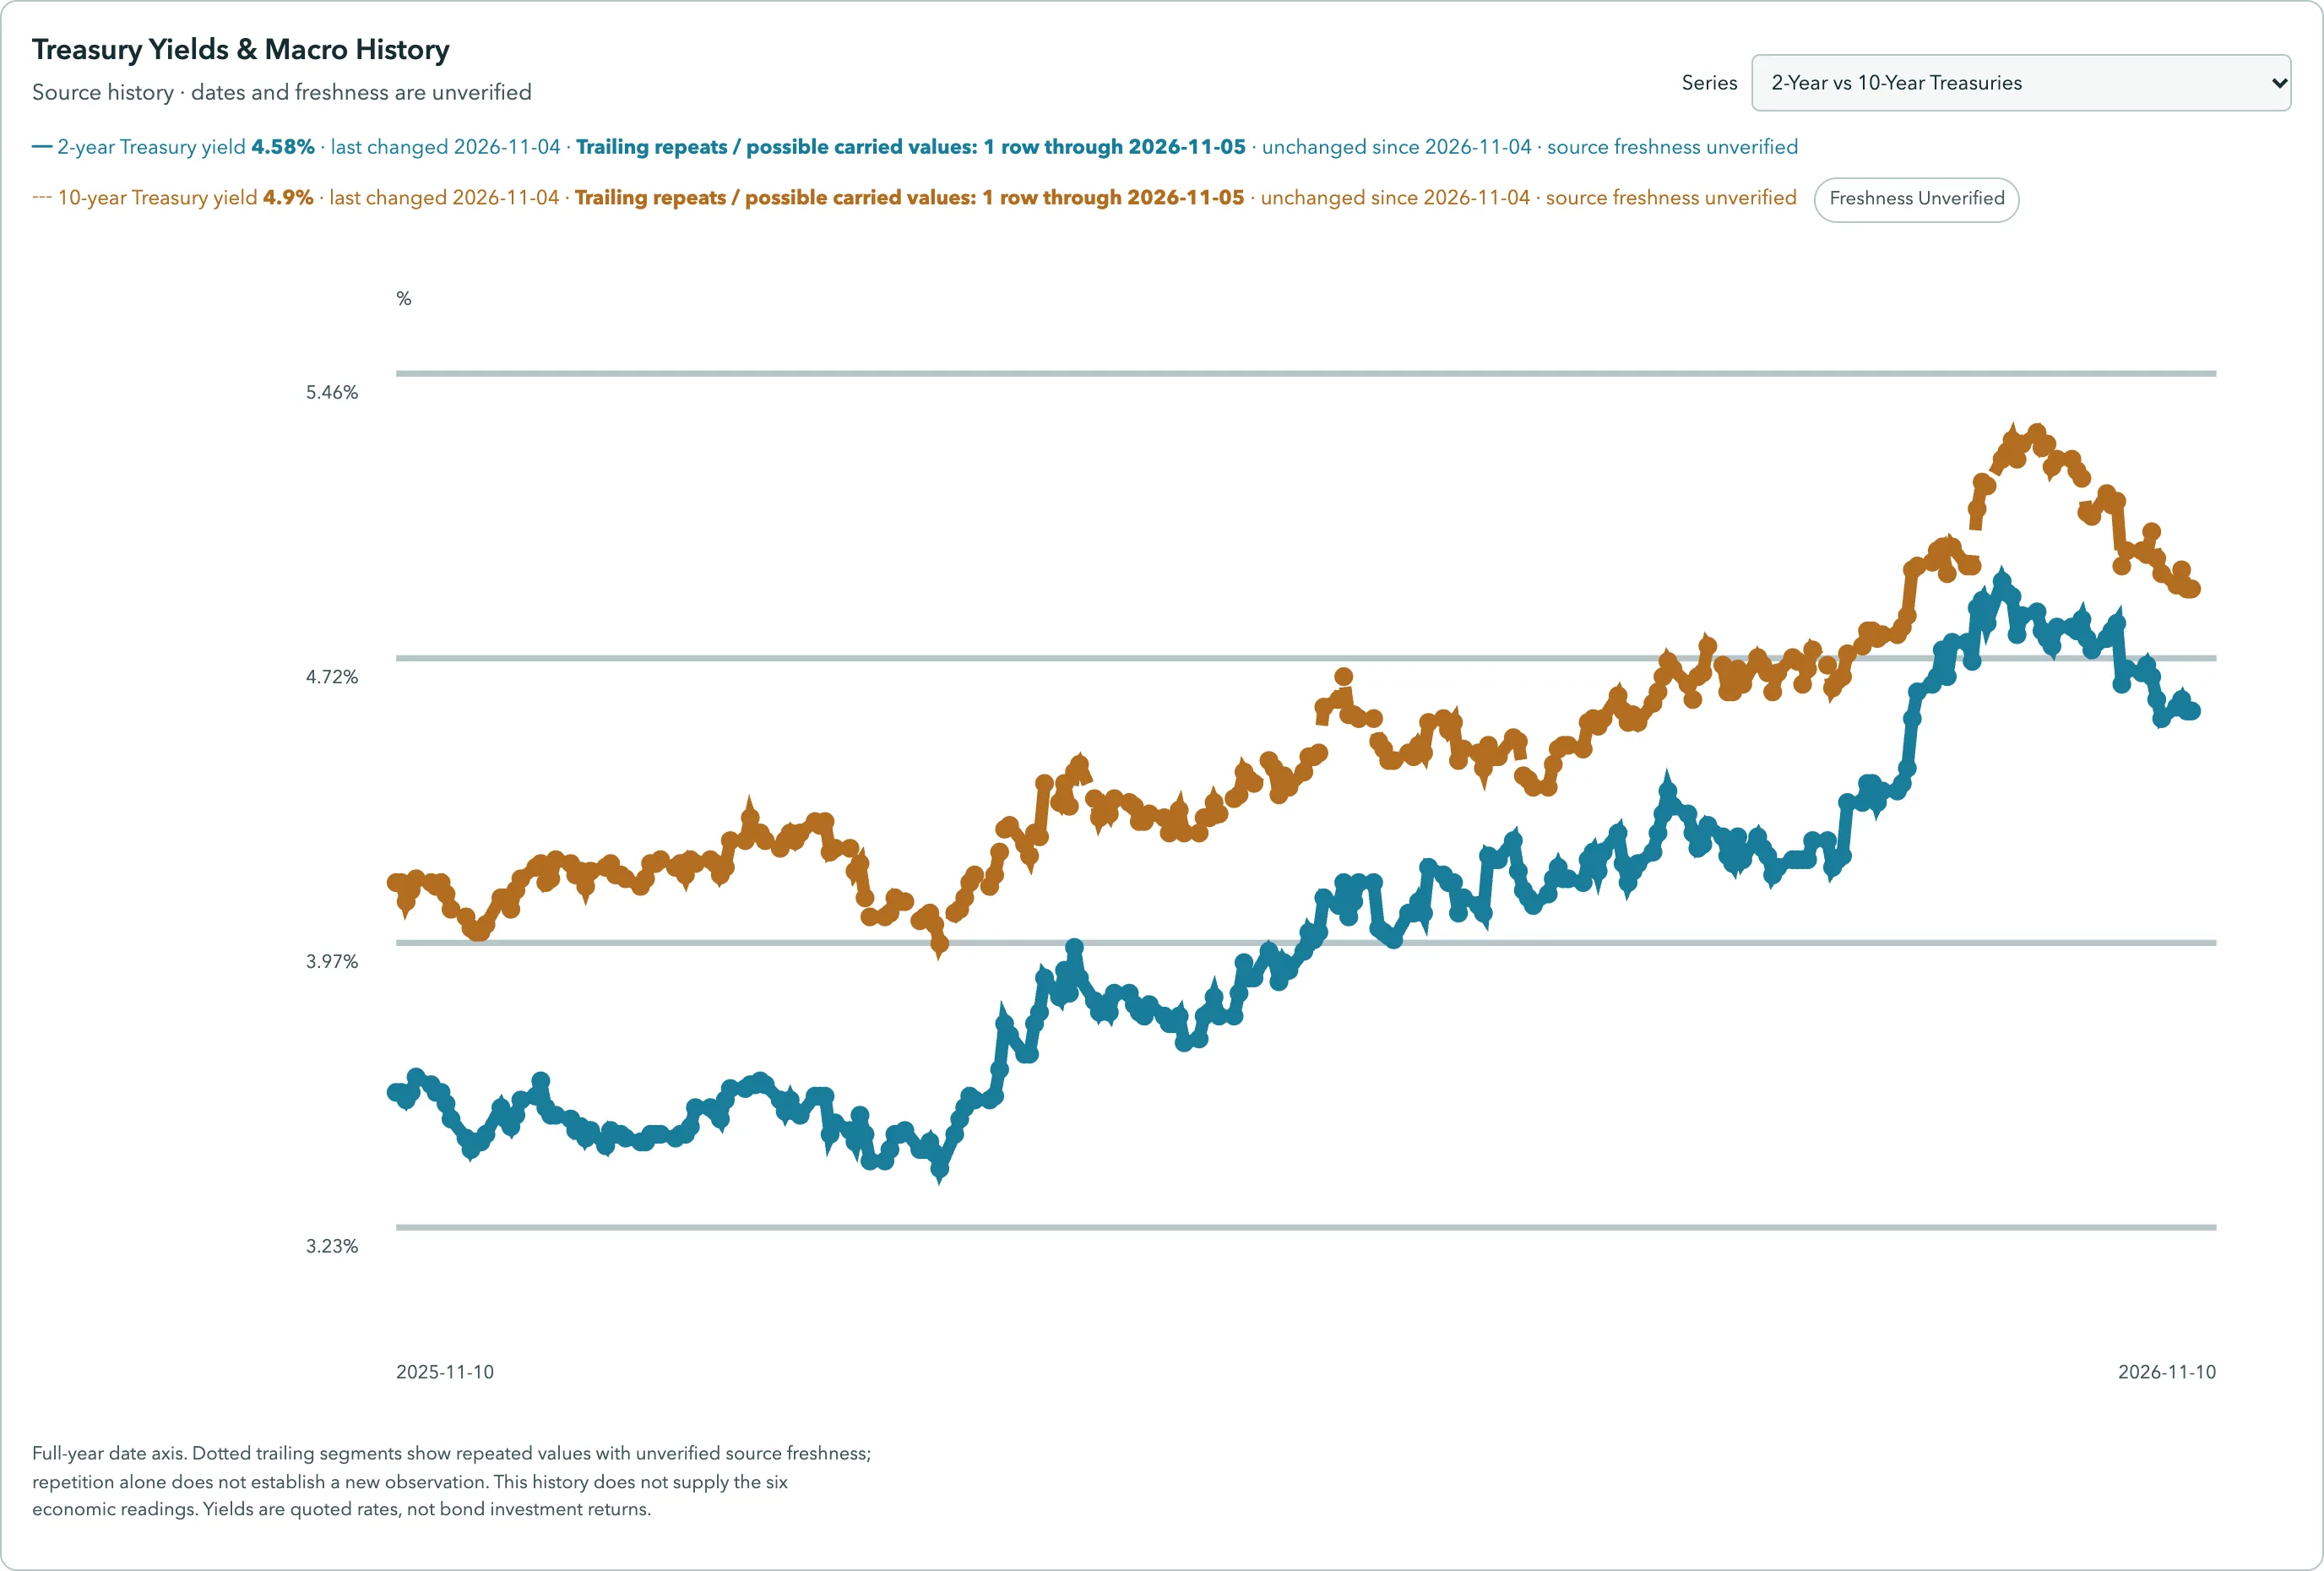
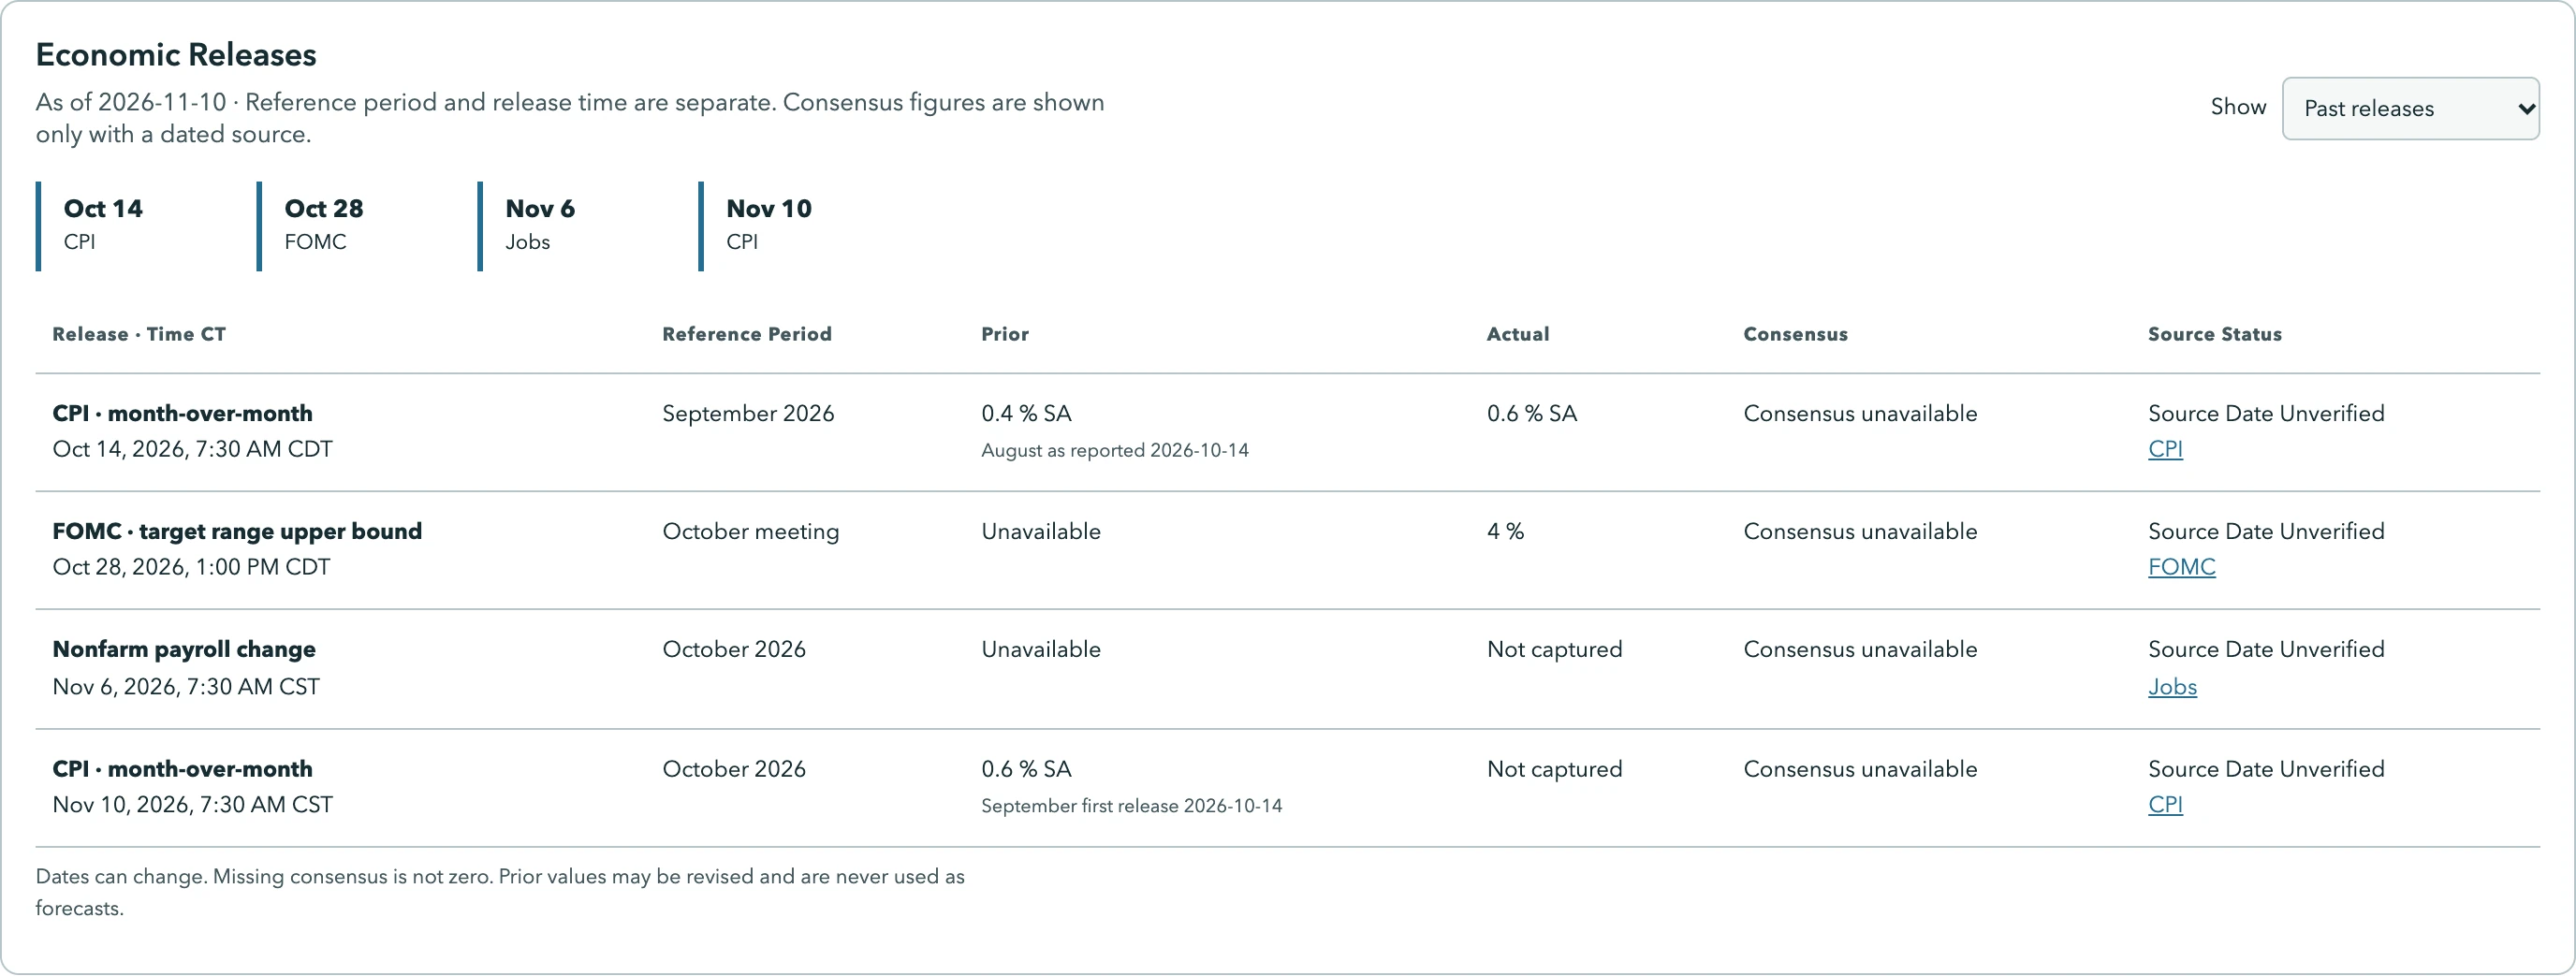
The panel's yield history still shows a 2-year at 4.58% and a 10-year at 4.9%, last changed November 4 and marked unverified. The Economic Releases table's past view lists Tuesday's CPI with the actual "Not captured" against a 0.6% prior.
Market History, Performance & DCA, Stock History
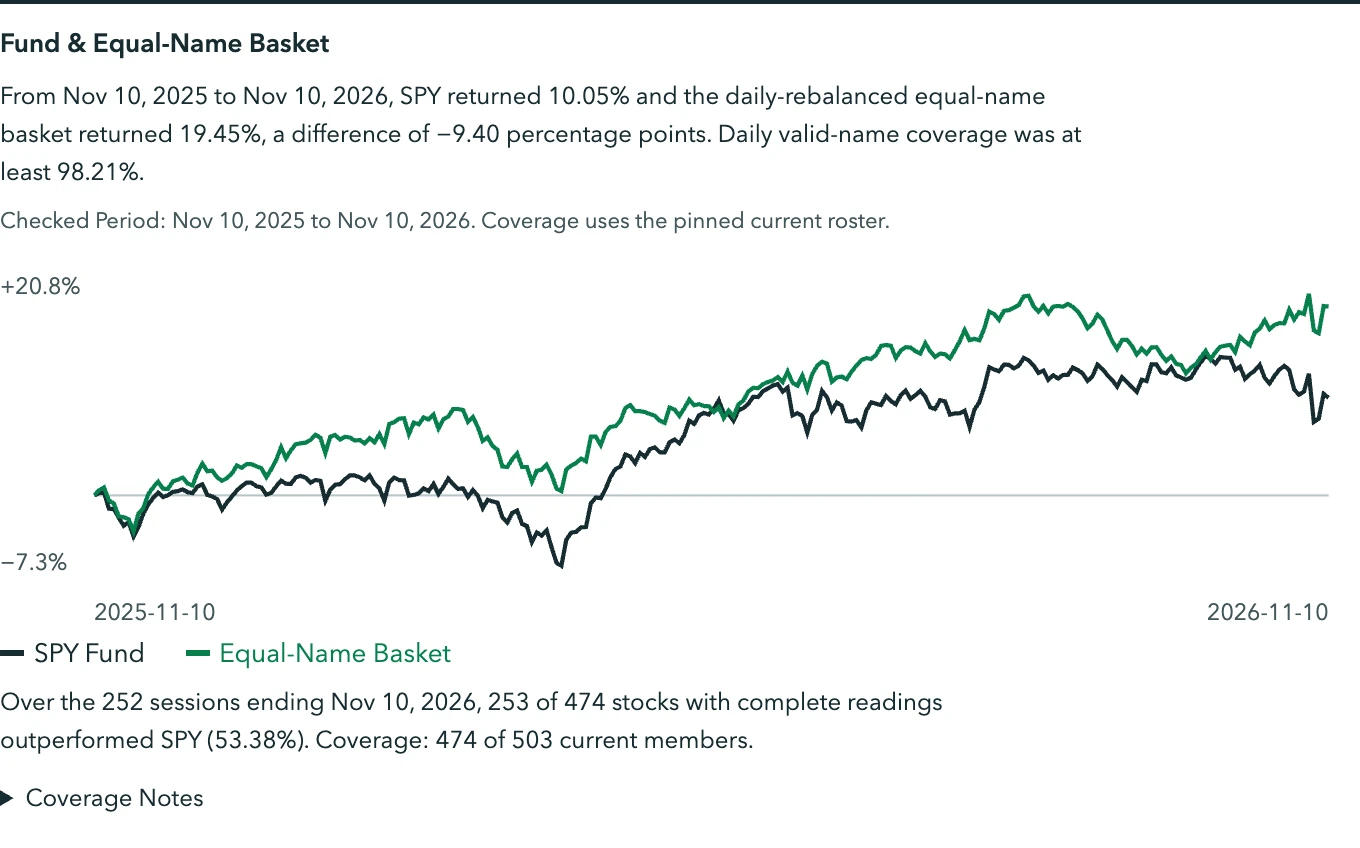
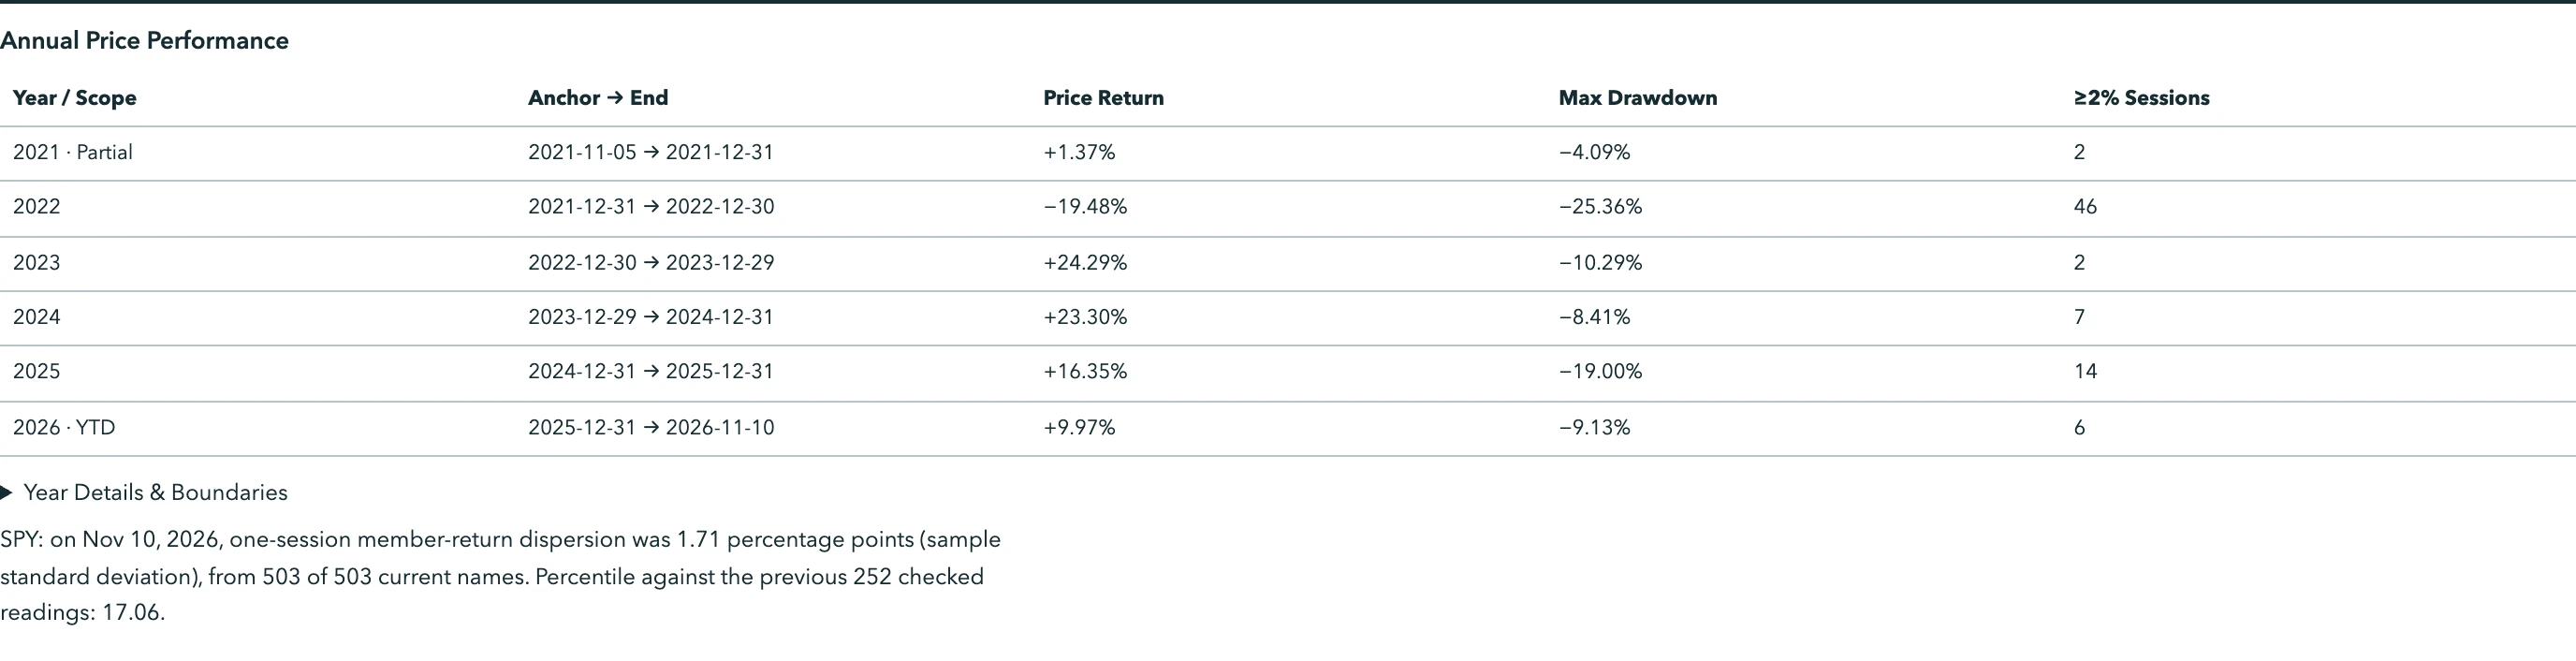
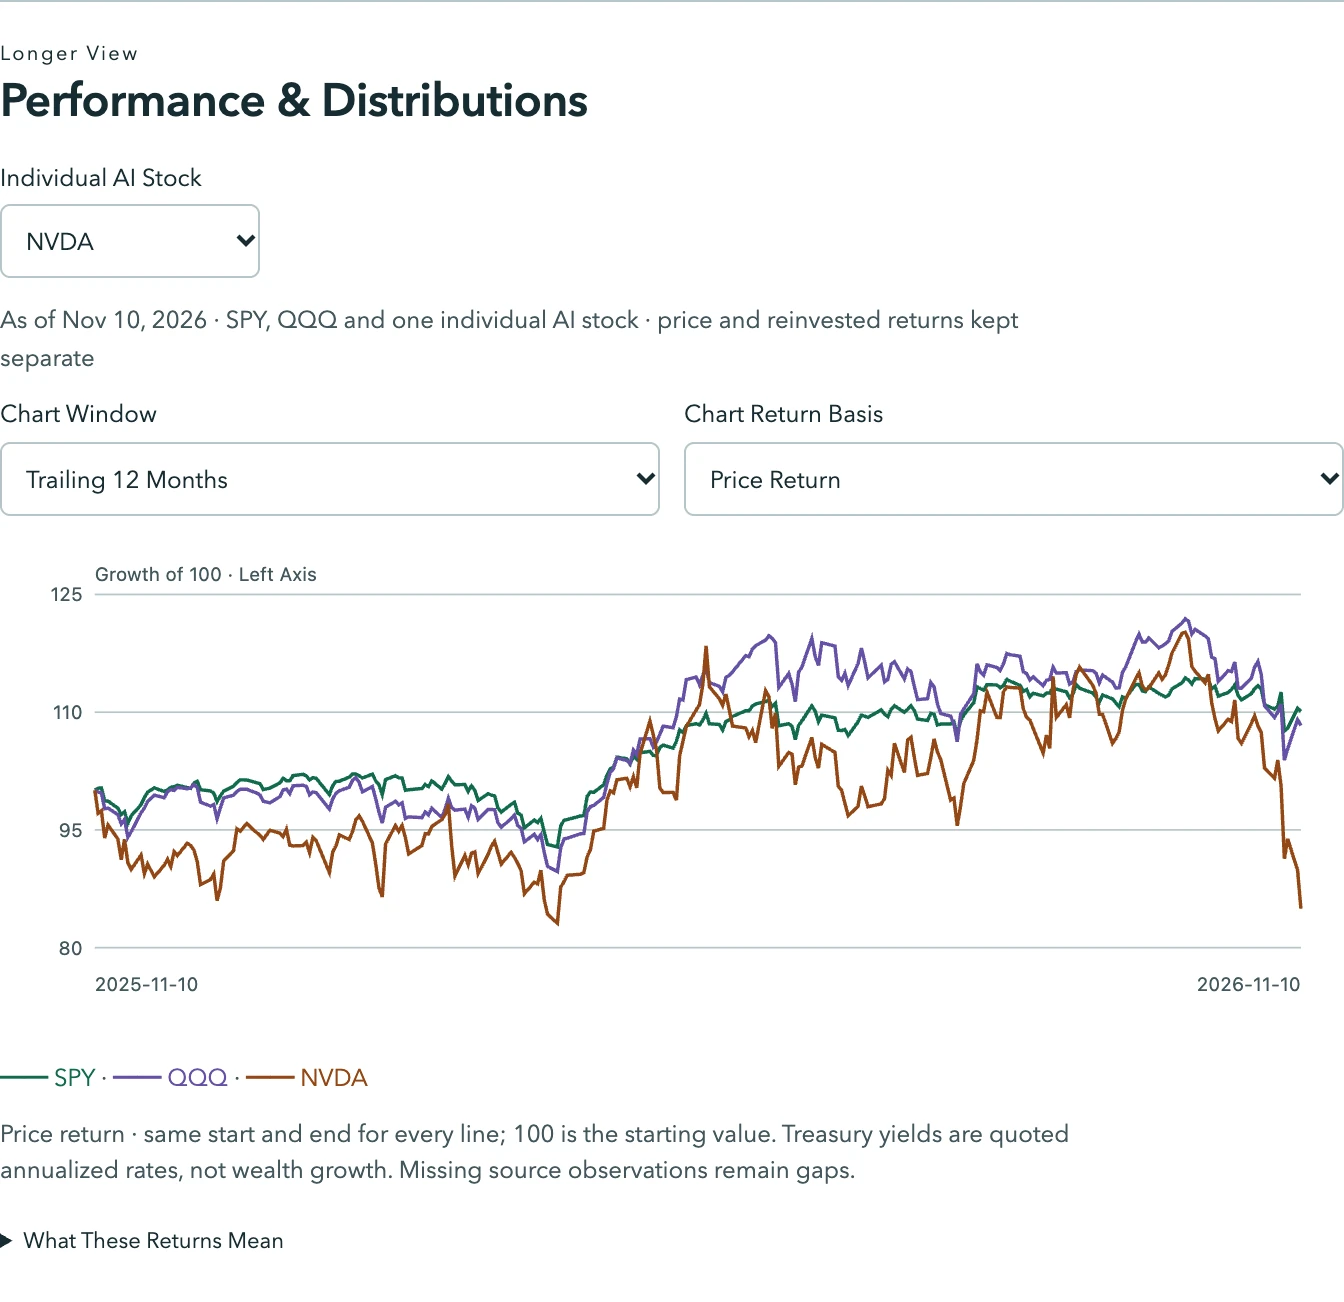
Over twelve months SPY returned 10.05% against 19.45% for an equal-name basket of its members, QQQ 8.27% against 25.51%; for 2026 to date, +9.97% and +9.84%. The Recurring Investment Calculator's default SPY case shows $16,500 contributed and $17,770 of value. The Performance chart shows NVIDIA behind both funds; Stock History's After Drawdowns card has insufficient data.
Flows
Figures come from the day's options tape and the dashboard's flow labels; sides are inferred, not confirmed purchases or sales; size and side do not prove intent; flow is context, not a forecast.
Market level: a smaller, slightly more defensive tape
Options prints of $25,000 or more added up to $23.19 billion in premium on Tuesday, against $34.93 billion on Monday and $42.75 billion on Friday. Puts took 52.8% of that premium on Tuesday, up from 50.6% on Monday but below 61.8% on Friday. Big-print put premium in SPY was $370.9 million on Tuesday against $541.3 million on Monday; in QQQ it was $427.0 million against $1.24 billion. SPY's big-money label fell from Very high to Normal and QQQ's to Low (its pricing label stayed Elevated, not Extreme); the activity lens rated 269 of 528 names Low, against 171 on Monday.
Sectors: one arithmetic artefact
Energy (1.07x) and Technology (1.04x) option volume ran busiest against their 30-day averages, Real Estate (0.57x) quietest. Consumer Defensive premium fell 90.5% from Monday, an artefact: 89.6% of Monday's premium was Target, $1.78 billion of deep-in-the-money calls the session before its November 10 dividend date (the dividend-arbitrage pattern, no direction); without Target the change is about −13.9%.
Single names: NVIDIA on both sides, Microsoft classified bullish
NVDA call volume ran 2.2 times its 30-day average and put volume 2.7 times while the stock fell 5.5%. In NVDA, premium classified as bearish exceeded premium classified as bullish by $126.1 million. MSFT fell 2.2% with put volume at 1.16 times its 30-day average; premium classified as bullish exceeded premium classified as bearish by $52.7 million.
Large and unusual prints: mostly financing and structure
The largest prints were SPX call-and-put packages at the 7000 and 8000 strikes in equal size across expiries from November 20 to June 2027 (one 13:12 ET package $723.6 million gross): box-spread shapes, financing with no market direction. The largest single-stock package was NVDA at 12:14 ET, four put legs across January and February 2027 ($204.6 million gross); netting its legs would invent a position, so no direction is inferred.
Tying it in
Put premium exceeded call premium in the semiconductor and small-cap funds (SMH 2.33 times, IWM 2.90 times), and GE Vernova's put volume ran 1.65 times its 30-day average; NVIDIA and GE Vernova were among the day's weakest prices on the dashboard, while the two funds' own price moves are not in our dashboard data. NVDA carried heavy two-way volume (3.9 million calls, 3.3 million puts) and fell 5.47%; its put premium outweighed its call premium, and much of the rest sat in structures that net to nothing. In our view the tape reads hedged and waiting, not panicked.
Economy
Released Tuesday, November 10: October CPI rose 0.4% on the month, seasonally adjusted, after 0.6% in September; core rose 0.3% for a third consecutive month; the reported consensus was 0.3% and 0.2%. The Bureau of Labor Statistics published no October 12-month headline or core rate because October 2025 data were not collected. Components, month on month: energy +0.7% (gasoline +1.0%), shelter +0.3% (owners' equivalent rent +0.3%), food +0.5%, used cars and trucks −1.2%. Treasury par yields: 2-year 4.73% (from 4.56%), 10-year 4.98% (4.88%).
Fed Governor Christopher Waller, in London before the release, backed a 25-basis-point December increase and said a 50-basis-point hike "should be considered" if core CPI ran "around 0.3 percent or even higher" (Federal Reserve text). As reported by Reuters and Investing.com: Dallas Fed President Lorie Logan said the Fed needs at least two more quarter-point increases; Vice Chair for Supervision Michelle Bowman sees "still work to do", without calling for hikes; Kansas City Fed President Jeff Schmid called policy "fairly accommodative". Reuters, citing futures, said a December increase of at least 25 basis points is fully priced and a 50 basis point move about 12% priced.
Improved since the previous release: headline CPI (0.6% to 0.4% m/m), shelter (0.4% to 0.3%), gasoline (9.1% to 1.0%), energy (5.2% to 0.7%).
Deteriorated: food CPI (0.0% to 0.5%); the 2-year (4.56% to 4.73%) and 10-year (4.88% to 4.98%) rose, a deterioration for equity valuations in our view; core unchanged at 0.3% against a 0.2% reported consensus.
What it means for SPY and QQQ (our view): bull evidence: the energy spike is over (gasoline 9.1% to 1.0%; Brent $91.49, per CNBC), shelter cooled a tenth, and the market absorbed the print with a flat median S&P stock and 62.8% of members above their 200-day. Bear evidence: three months of core at 0.3%, meeting Governor Waller's stated condition for considering 50 basis points, President Logan's call for at least two more hikes, and a 17-basis-point day in the 2-year. In our view the rate path is now the main risk to both funds; a hot PPI on Friday would harden it.
Next release that could change this: October PPI, Friday, November 13, 08:30 ET; then FOMC minutes Nov 18 and November CPI Dec 10†.
Outlook
Scenarios with conditions, not forecasts; the weights are our subjective leanings and sum to 100. They cover Wednesday, November 11 through Friday, November 13, so exactly one happens; the bear lines are Monday's opening prices, the bull levels Tuesday's averages. Our lean is modestly bullish on the broad market: the bull and base cases together carry 70% of the weight, the base case is a hold, and the bear case has a named trigger.
Bear — "the gap closes" (about 30%, from 25%).
- Trigger: any SPY close below Monday's opening price of $741.95, or any QQQ close below $662.64, Wednesday through Friday.
- Path: a close below either line puts the November 5 closing lows in play, $733.00 for SPY, just above its 200-day average at $730.99, and $647.05 for QQQ. The most exposed moment is Friday's 08:30 ET PPI; a 2-year par yield above 4.73% or a 10-year close above 5.00% would be the accompanying sign.
- Leaders and laggards: relative leaders would be Tuesday's advancing majorities outside Technology, Consumer Defensive (56.3% advancing), Utilities (53.1%) and Energy (median +0.83%). Laggards would be the names already carrying put premium: the semiconductor and small-cap funds (put premium 2.33 and 2.90 times call premium), NVIDIA (premium classified as bearish exceeded bullish by $126.1 million; RSI 23.9), GE Vernova (put volume 1.65 times its 30-day average); homebuilders, already weak after Lennar's −5.37%, would also lag.
- Window: any close from Wednesday, November 11 to Friday, November 13.
- Invalidation: both lines intact at Friday's close; the case then expires into base or bull.
Bull — "the averages are reclaimed" (about 20%).
- Trigger: neither line breaks, and on Friday, November 13 SPY closes above its 20-day average of $760.69 and QQQ above its 200-day average of $681.42 (both as of Tuesday; rises of 1.44% and 0.99%).
- Path: SPY through its 20-day toward its 50-day at $765.00; QQQ through $681.42 with its 20-day at $700.86 as the next reference.
- Leaders and laggards: the broad leadership of Financial Services and Industrials continues, and the semiconductor side of the AI 30 keeps Tuesday's bid, Broadcom +3.91%, TSMC +2.02%, AMD +1.30%, joined, on the options tape only, by Microsoft, where premium classified as bullish exceeded bearish by $52.7 million even as the stock fell 2.20%. In our view QQQ does not clear its 200-day with only a quarter of Nasdaq-100 Technology members rising, as on Tuesday (24.4%). NVIDIA, trading on unverifiable headlines into its November 17 report, can lag in this case too; the bull case does not need it.
- Window: Friday's close.
- Invalidation: a bear-line break at any close, or Friday closes below either average.
Base — "the band holds" (about 50%).
- Trigger: neither line breaks, and Friday's closes do not clear both averages.
- Path: SPY holds between $741.95 and its 20-day average of $760.69, around Tuesday's close of $749.92 and its 9-day exponential average of $751.94; QQQ holds between $662.64 and its 200-day at $681.42, the level that capped Tuesday's high at $680.95.
- Leaders and laggards: the median stock and Tuesday's leading sectors, Financial Services (70.1% advancing), Communication Services (60.9%) and Energy (median +0.83%), with Industrials (62.5% advancing) leading inside the Nasdaq-100. Laggards are cap-weighted Technology (37.9% of S&P members advancing, 24.4% in the Nasdaq-100) and the AI 30 (Marvell and Dell are in it); separately, the S&P's five worst 20-session performers are all AI hardware names: Intel −43.46%, Marvell −42.55%, Sandisk −41.98%, Dell −41.59%, Lumentum −40.73%. The AI 30 above-50-day count stays near 4 of 30.
- Window: through Friday's close.
- Invalidation: either bear line at a close, or Friday closes above both $760.69 and $681.42.
Before turning constructive on concentrated AI we would want: the AI 30 count above its 50-day rising from 4 toward a third; a QQQ close above $681.42 that holds; NVIDIA holding $168.89 into its report; the 2-year no higher than 4.73% after PPI.
Warning signs that would strengthen the case for caution: SPY below $741.95 or QQQ below $662.64 at a close; a 10-year par yield closing above 5.00%; S&P members above the 200-day under 55%; new lows exceeding new highs (Tuesday: 7 to 3); the AI 30 above-50-day count at 3 or fewer; QQQ's pricing label at Extreme on a down day.
Dip, wait, or trim? In our view the broad market still reads as a pullback inside an uptrend: SPY is 2.59% above its 200-day, 62.8% of S&P members are above theirs, the median member's 14-day RSI is 56.9, higher than 93.2% of the past year's daily readings of that median, even as the fund's own RSI sits at 44.6, and the lines we set on Monday held through a hot CPI. That is why we lean modestly bullish into Friday rather than neutral: 70% of our weight sits on the two scenarios in which Monday's opening prices hold, and the base case is a hold, not a slide. The lean is modest because the warning sign we named on Monday, core CPI at 0.3% with the 2-year rising from 4.56% to 4.73%, is live, and the bear trigger is named: a close below $741.95 in SPY or $662.64 in QQQ, most exposed at Friday's PPI. Concentrated AI is the laggard in every scenario until the above-50-day count turns up from 4 of 30 and NVIDIA holds $168.89. Investors adding on weakness would, in our view, look to the broad market and Tuesday's leading sectors rather than to concentrated AI, with the opening prices intact as the condition; a case for trimming would strengthen on either bear trigger or a 10-year close above 5%. Net: modestly bullish on the broad market with a named bear trigger; AI stays the laggard until its repair count turns.
Key dates (times ET; dates can change; † = unverified): Wed Nov 11 — Veterans Day (stocks open; cash-bond close recommended by SIFMA; no BLS or Fed releases). Thu Nov 12, 08:30 — jobless claims†. Fri Nov 13, 08:30 — October PPI. Tue Nov 17 — retail sales; NVIDIA after the close. Wed Nov 18, 14:00 — FOMC minutes; Anthropic IPO pricing, as reported by CNBC. Wed Nov 25† — GDP and PCE. Fri Dec 4† — jobs report. Thu Dec 10† — CPI.
Final summary
- Monday's opening prices still decide the broad read: $741.95 for SPY, $662.64 for QQQ. Closes below would, in our view, mean the rebound failed and put the November 5 closing lows ($733.00 and $647.05) in play; Friday closes above $760.69 and $681.42 would mean it extended. Our lean is modestly bullish: 70% of our weight is on the lines holding.
- PPI at 08:30 ET Friday. A 2-year above 4.73% or a 10-year close above 5% after it would, in our view, say the pressure on growth valuations is growing.
- The AI repair count and NVIDIA. Four of 30 above the 50-day is moving away from repair; that count rising, and NVIDIA holding $168.89, would separate a low from a pause.